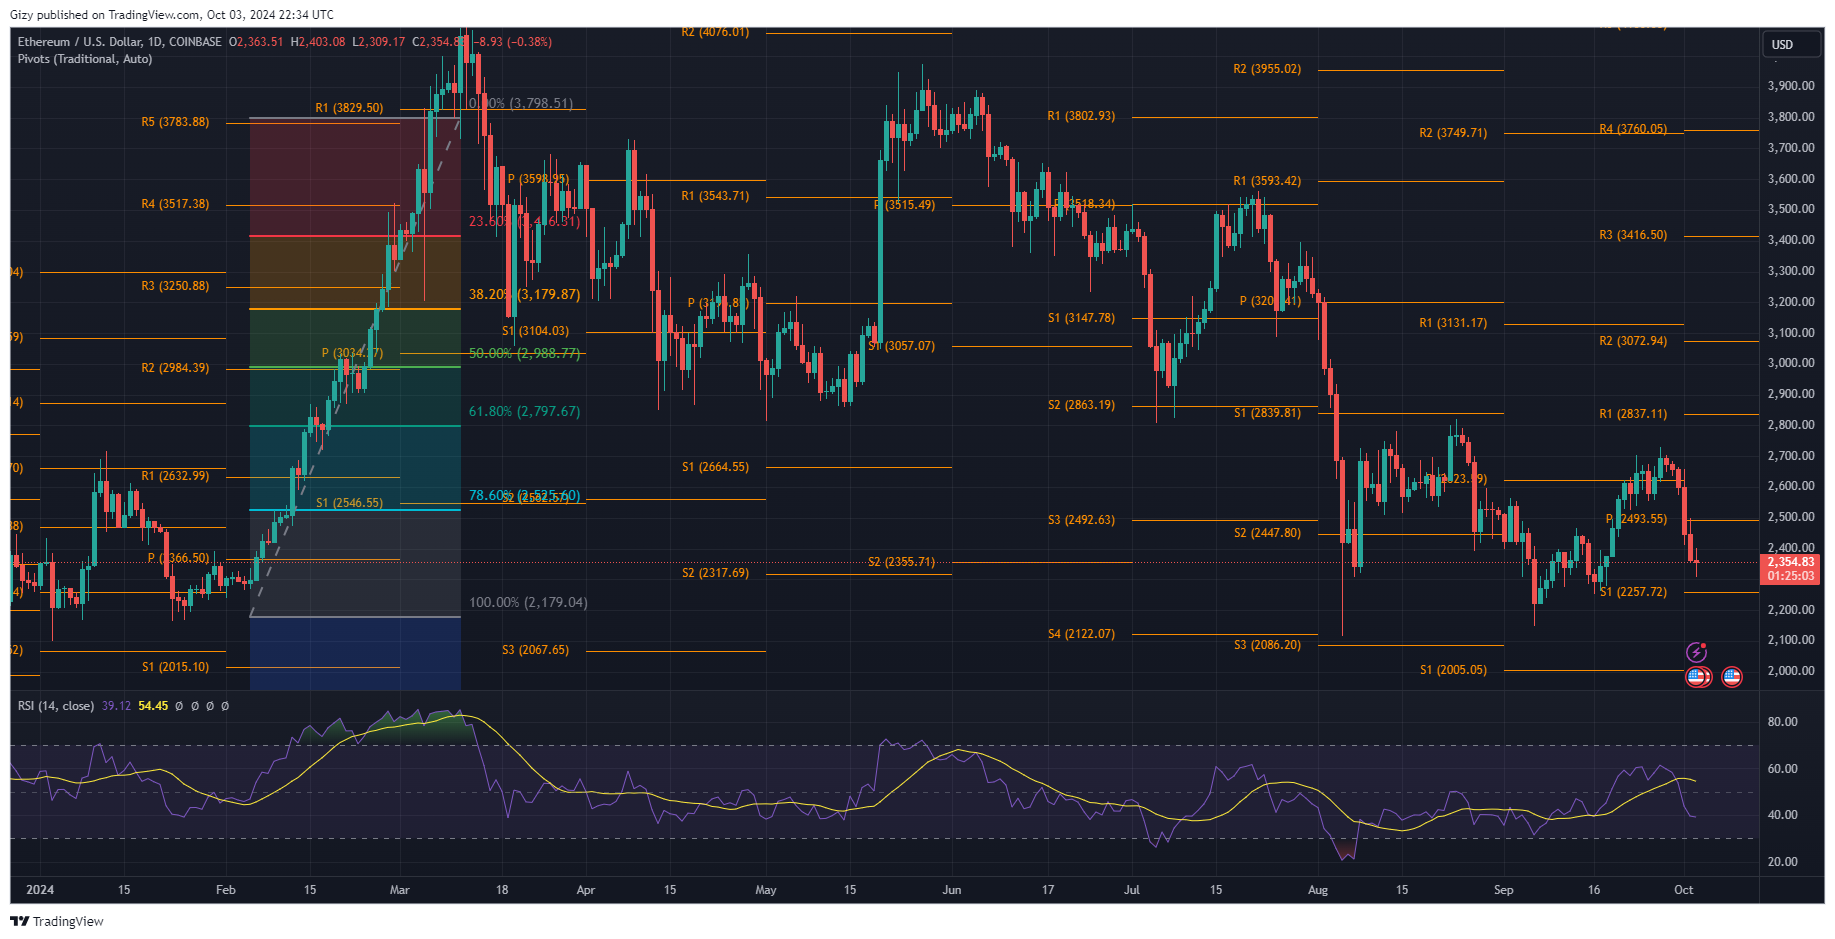
Ethereum was off to a good start as many anticipated the end of the massive declines. However, it is printing its sith consecutive red candle.
The massive decline started last Saturday when it struggled to stay above $2,700, dipping to $2,650. The dump worsened on Monday as ETH lost the $2,600 support, losing over 2% in value.
Geopolitical tension also caused a massive increase in selling as the crypto market and other commercial sectors saw some traders panic sell, resulting in substantial price declines. The apex altcoin dropped from $2,657 to a low of $2,413. It rebounded but failed to reclaim $2.5k and registered losses exceeding 5%.
The fear continued as the market saw another wave of selloffs, resulting in an over 3% drop during the previous intraday session.ETH lost the $2,400 support.
However, it is off to a good start at the time of writing. It is attempting to reclaim $2,400 as it gets closer to it. It may break above it, as it briefly flipped a few minutes ago. However, the coin is seeing a massive change in on-chain metrics.
Derivatives Traders are Bullish
On-chain data shows several indicators flipping bullish amidst the growing bearish actions, resulting in notable price declines. The first on the list is the derivatives market. Traders in this sector are bullish, increasing the funding and aggressively adding more to their positions. The metric also suggests new long positions following the coin’s recent low.
Other data points to a massive buy order at different price levels. One such is the $3,430 mark. Although there are several demand concentrations before the barrier, the bulls are looking to reclaim the $2,400 level.
However, more traders are pulling out from their positions as more sell orders are filling due to the bearish market state. There is also less open interest at the time of writing compared to the previous intraday session.
The spot market is showing minor signs of resistance to the ongoing trend. For example, Ethereum retraced to a low of $2,300 a few hours ago but rebounded as buying pressure improved. Currently printing a doji, the asset may see a trend reversal.
However, these improvements did not change anything in the indicators on-chart and chain. The funding rates for the apex altcoin are still low as investors in the US and Korea are still fearful of what lies ahead. Such fears reduce the fear and greed index below 50 as it spreads across the entire market.
Nonetheless, exchanges are seeing a notable outflow of the coin from their reserves. The exchange netflow total is also negative as more traders went bullish, pulling holdings to cold storage. On-chain RSI and Stochastic are also neutral, which may mean the bulls are gearing up for buybacks.
Ethereum could Reclaim $2,400
The drop in ETH to $2,300 sparked fears of a further decline to $2,200. However, there are indications that the bulls may resume the uptrend. In addition to the buy orders at $2,430, the current-day candle suggests an impending change in price trajectory.

The one-day chart shows the relative strength index halting its decline. The metric was at 61 at the peak of the previous bullish round but dropped to a low of 38 at the time of writing. A closer look at the RSI shows a significant change in trajectory as it slightly reduced its angle of depression due to notable buying pressure.
ETH’s current price, $2,257, places it closer to the first pivot support. However, if trading conditions keep improving, the asset will resume its bid above the pivot point, $2,493.
Other Ethereum tokens like PEPE and SHIB may also resume their uptrend once it picks up. It is also worth noting that the current readings coincide with news of the project ICO account selling over $79 million in assets.
