
Ethereum was one of the worst-hit by the latest price descent. Significant selling pressure is pushing prices lower.
The market took a turn for the worse a few hours ago following a shift in sentiment. The largest altcoin opened trading at $2,513 and experienced slight increases but retraced afterward. It continued downward, breaking the $2,400 support. It tested $2,300 but rebounded at $2,319.
The latest dip continues the previous day’s trend. The candlestick representing price action on Monday was the longest over the last six months. ETH opened trading at $2,819 but retraced, breaking the $2,600 and hitting a low of $2,471. The asset lost almost 11%.
The cryptocurrency has since rebounded and traded at $2,453 at the time of writing. The latest recovery shows that the bears may be getting exhausted.
Are the Bears Exhausted?
It is essential to understand the reasons for the latest declines before deciding on the current state of the market.
The latest decline is not peculiar to Ethereum, as other cryptocurrencies are on a downtrend. The global cryptocurrency market retraced from $3 trillion to $2.85 trillion. Several cryptocurrencies retraced to their lowest this year.
A shift in market sentiment was responsible for the declines. Nonetheless, Donald Trump triggered the latest reactions. He announced tariffs on Canada, Mexico, and China a few weeks ago. However, the effects of these duties were on hold as diplomatic discussions were ongoing.
Investors expected the series of meetings between the United States President and his Canadian counterpart to end the trade wars. However, POTUS announced Monday that the extra tax would take effect this week.
Traders fear that the ongoing trade war will negatively impact the world economy. They predict further inflation in the coming day as the prices of affected commodities rise.
The increases in ETH price may be short-lived if the trade war continues. The crypto fear and greed index sank below 30, indicating massive FUD. Nonetheless, the chart points to further price increases.
Ethereum Plots Return to $2,600
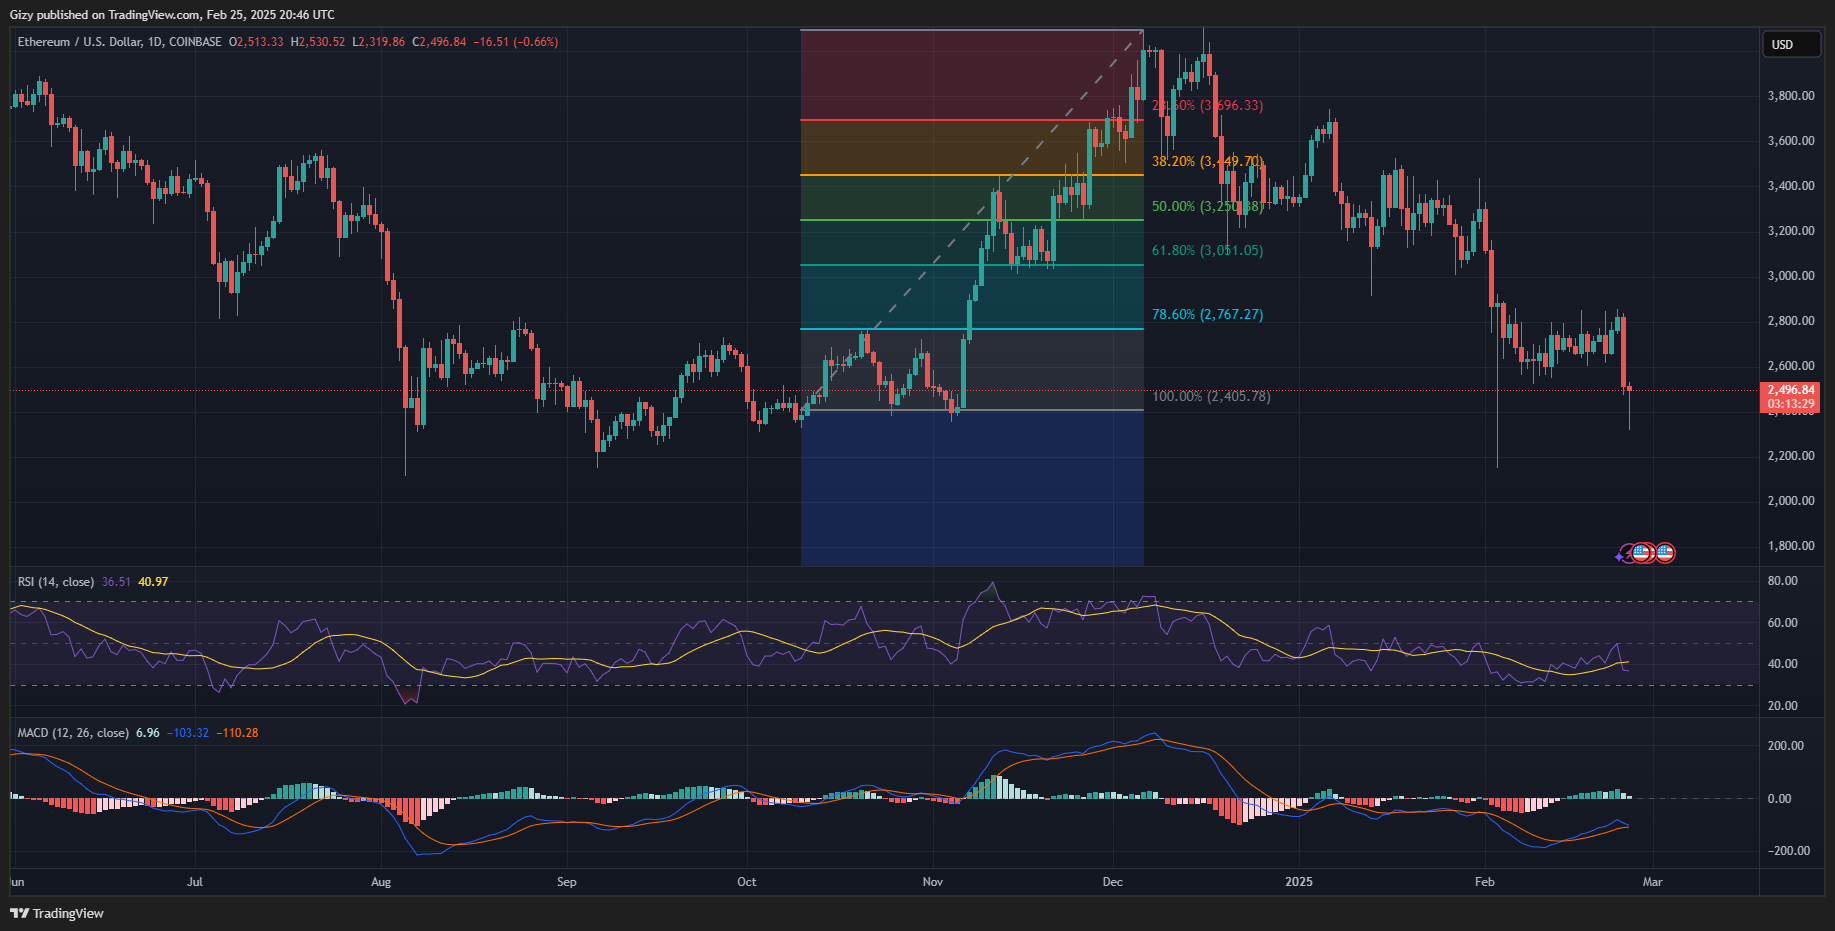
Indicators on the one-day chart point to an ongoing buyback. The relative strength index edged closer to 30 as the downtrend continued. However, an increase in buying pressure is driving the metric up. It is at 36 at the time of writing.
The bollinger band points to an impending surge. ETH slipped below the lower SMA during the previous intraday session. Such a trend may mean an impending trend reversal. The ongoing price trend may be in response to it. The largest altcoin may retest the middle band around $1,672, indicating a flip of the $2,600 barrier.
Nonetheless, the moving average convergence divergence displays a bearish convergence. The metric had a bullish divergence a few days ago and has continued upward. The 12-day EMA halted its uptrend in reaction to the recent declines. An interception between the 12-day EMA and 26-day EMA nears completion, which may mean further Ethereum declines.
The Fibonacci retracement levels show that the largest altcoin is trading below the 100% fib level. Previous price movements show notable demand concentration at the mark. Ethereum may hold this mark for an extended time until it attempts the 78% fib mark.
