The need for an Ethereum price prediction stems from the most recent uncertainty in price. During the previous intraday session, it traded in the opposite direction as Bitcoin.
The change in trajectory came after the coin saw a massive improvement in trading volume. According to Coinmarketcap, there was a more than 25% increase in trading volume. However, on-chain data show that the bears are gearing up to test supports.
A large number of the trading volume was from bearish traders. Exchanges saw inflows of over 158,000 coins, over 5% higher than the over 149k that entered these trading platforms. Additionally, ether in exchange reserves slightly increased during the session.
Regarding fundamentals, analysts and experts are unsure whether the Ethereum ETF will get approval from the US SEC this year. Amidst this uncertainty, reports indicate that Franklin Templeton listed its ETH ETF on the DTCC website.
Aside from actions from the United States, the crypto community eagerly anticipates the approval of Bitcoin and Ether ETFs.
How will this news affect ETH in 2024 and beyond?
Ethereum Price Prediction 2024
On-chain readings suggest the current uptrend is unsustainable. The difference between the amount of exchange inflow and outflows points to an impending selloff. The increasing numbers of this asset in exchange reserves buttress this claim.
Despite the negative funding rate figures, the number of transactions illustrates the reason for the most recent price hike. Per on-chain data, the withdrawal transactions of ETH from trading platforms are five times greater than the deposits.
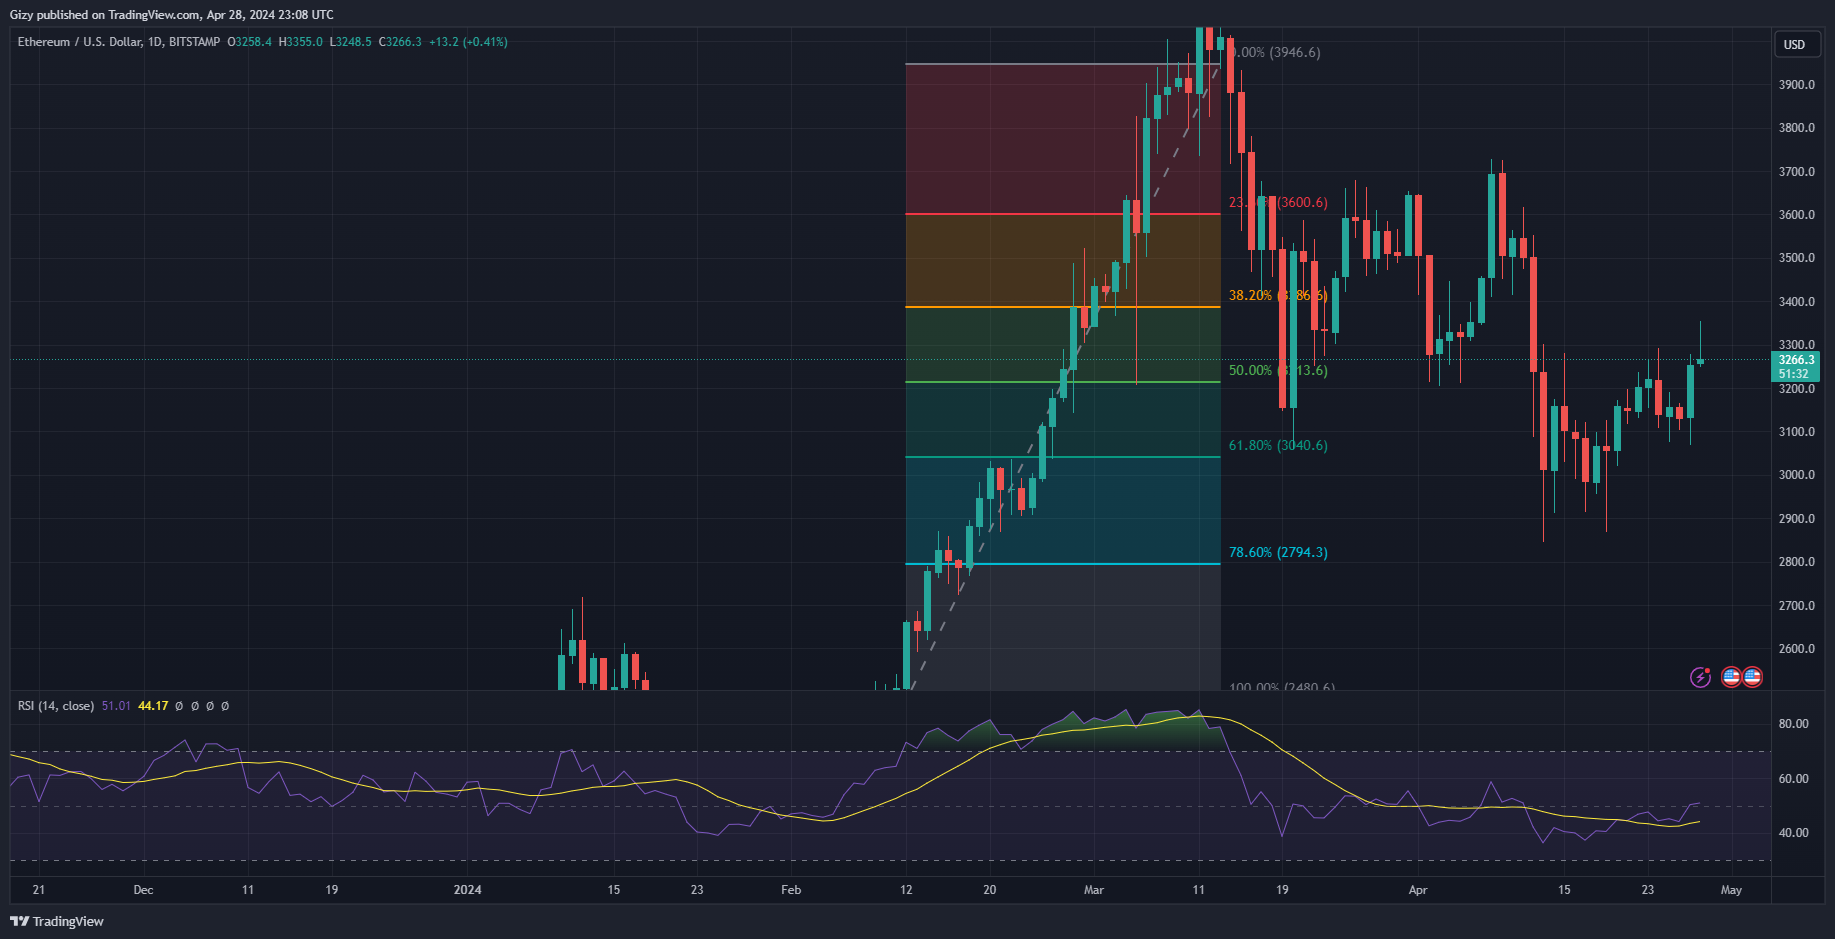
Indicators like the moving average convergence divergence and the relative strength index are printing bullish signals in response to price increases. For example, MACD showed a bullish divergence on April 23. Since the interception, ether has failed to surge as expected. However, the most recent price hike is pushing the 12-day EMA.
The RSI is also on the uptick, having climbed above 53. Currently trending above 50, it gives the bulls an advantage. The same trend is also seen in the accumulation and distribution channels, suggesting a healthy price correlation with trading volume.
The asset dipped to the first pivot support twice in the last seven days. On both occasions, it briefly flipped but returned above it. If the bulls continue sustaining the buying pressure, the coin will attempt its pivot point at $3,600. Nonetheless, it peaked at $3,355, exposing the bearish actions before $3,400.
On the other hand, failure to continue the current trend will leave the apex alt open to further price decline. Aside from the first pivot support, the PPS hints at a drop to $2,500 if S1 fails. However, the Fibonacci retracement points to a notable demand concentration of around $3,200 (50% Fib) and $3,000 (61% Fib).
While these readings and speculations cover only the next few weeks, the Ethereum rainbow shades further light into ether’s possible peak in 2024.
Ethereum Rainbow Chart
The rainbow chart is a critical tool for long-term market analysis. It points to levels the second-largest cryptocurrency will attain in the coming years. Nonetheless, no definite metric answers when these predictions will take effect.
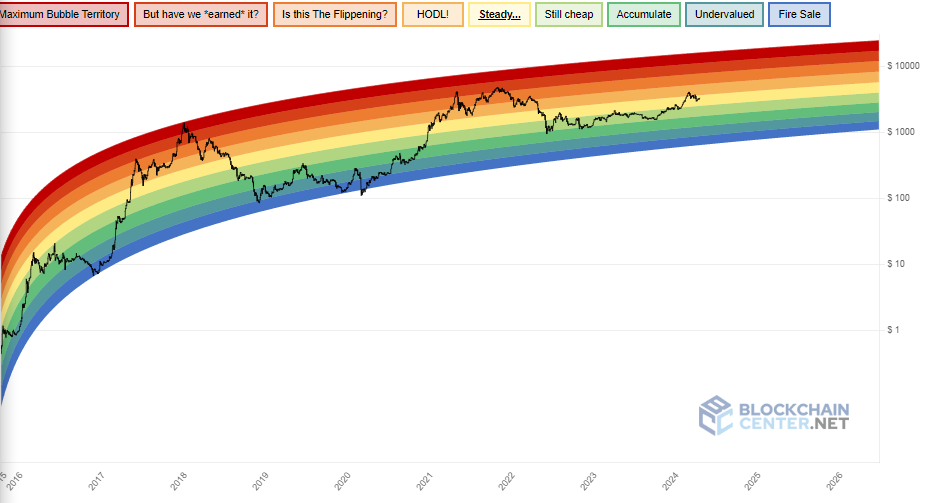
The chart above shows price action since 2015 and offers insight into how prices behave during a specific period. One such is how ETH reacts to Bitcoin halving. They run the same cycle based on the asset’s correlation with the apex coin.
For example, the chart above suggests that the apex altcoin takes four to eight months to resume its uptrend after a halving. This trend happened in 2016 when ether started its uptrend six months after the event. It also occurred in 2020, as it took four months for the bull run to come into full motion. This was also the case with BTC.
If this holds, ETH will look to start the uptrend during the third or fourth quarter. The asset will likely see significant bullish moves between August and December. Nonetheless, it will end the year around the yellow and brown regions. A close within these regions will mean it will peak at around $4k and $6k.
Ethereum Price Prediction 2025
Following a bullish close in 2024, the asset will look to continue its run in 2025. The chances of this happening are high, as historically, the year following bitcoin halving has been one of the most favorable periods for ETH.
This trend has been present before. For example 2017, the apex altcoin surged by over 9,000%. The same happened in 2021, when the asset surged by over 398%. On average, it gains over 4,600%. While the figure is improbable during this run, ether will likely see up to a 200% increase. This speculation also considers the unavailability of significant fundamentals that could thwart the run.
Nonetheless, the Ethereum community will look to continue to push the agenda of ETH flipping BTC. The calls will continue as the second-largest cryptocurrency sees more adoptions and use cases.
A closer look at the rainbow shows that ether peaked within the red and dark red regions (the highest points on the chart). If the same plays out this time, traders can expect it to surge as high as five figures.
Having ended 2024 around $4k, ethereum will look to continue the surge. During the first quarter, the cryptocurrency will climb to the brown region, placing prices at around $6k and $9k. The trend will continue into the next quarter. However, in Q3, ETH will climb to the red region, placing prices at around $10k and $14k. In Q4, ETH will be worth around $12k and $16k.
Price Prediction 2026
The rainbow chart suggests that the apex altcoin will end its bull run towards the end of 2025. The end will spell a bearish start to 2026. This won’t be the first time such a trend is happening. For example, in 2018, ETH dipped by over 82%, and in 2022, it lost over 67%. On average, it loses over 74% as the bullish run ends.
With this in mind, traders will expect a decline that will take more than half the altcoin’s value. Closing 2025 around $14k will see the asset lose its five-figure status. It will drop as low as $5k before the end of the period in focus.
Price Prediction 2027
Following the bear market in 2026, the cryptocurrency will look to reclaim lost levels in 2027. The assertion is based on previous price movements in the year leading up to the following bitcoin halving. A closer look at the chart suggests that ETH will experience more price increases during the year in focus.
This trend happened in 2019 when the asset surged from $130 to a high of $363. In 2023, it surged from $1,192 to a high of $2,447 and closed with gains exceeding 90%.
A repeat of this trend will see ETH attempt a return to five figures. It remains to be seen if it’ll
