
Ethereum has been in a downtrend since Saturday, experiencing slight corrections that cumulated into a decline of more than 5%.
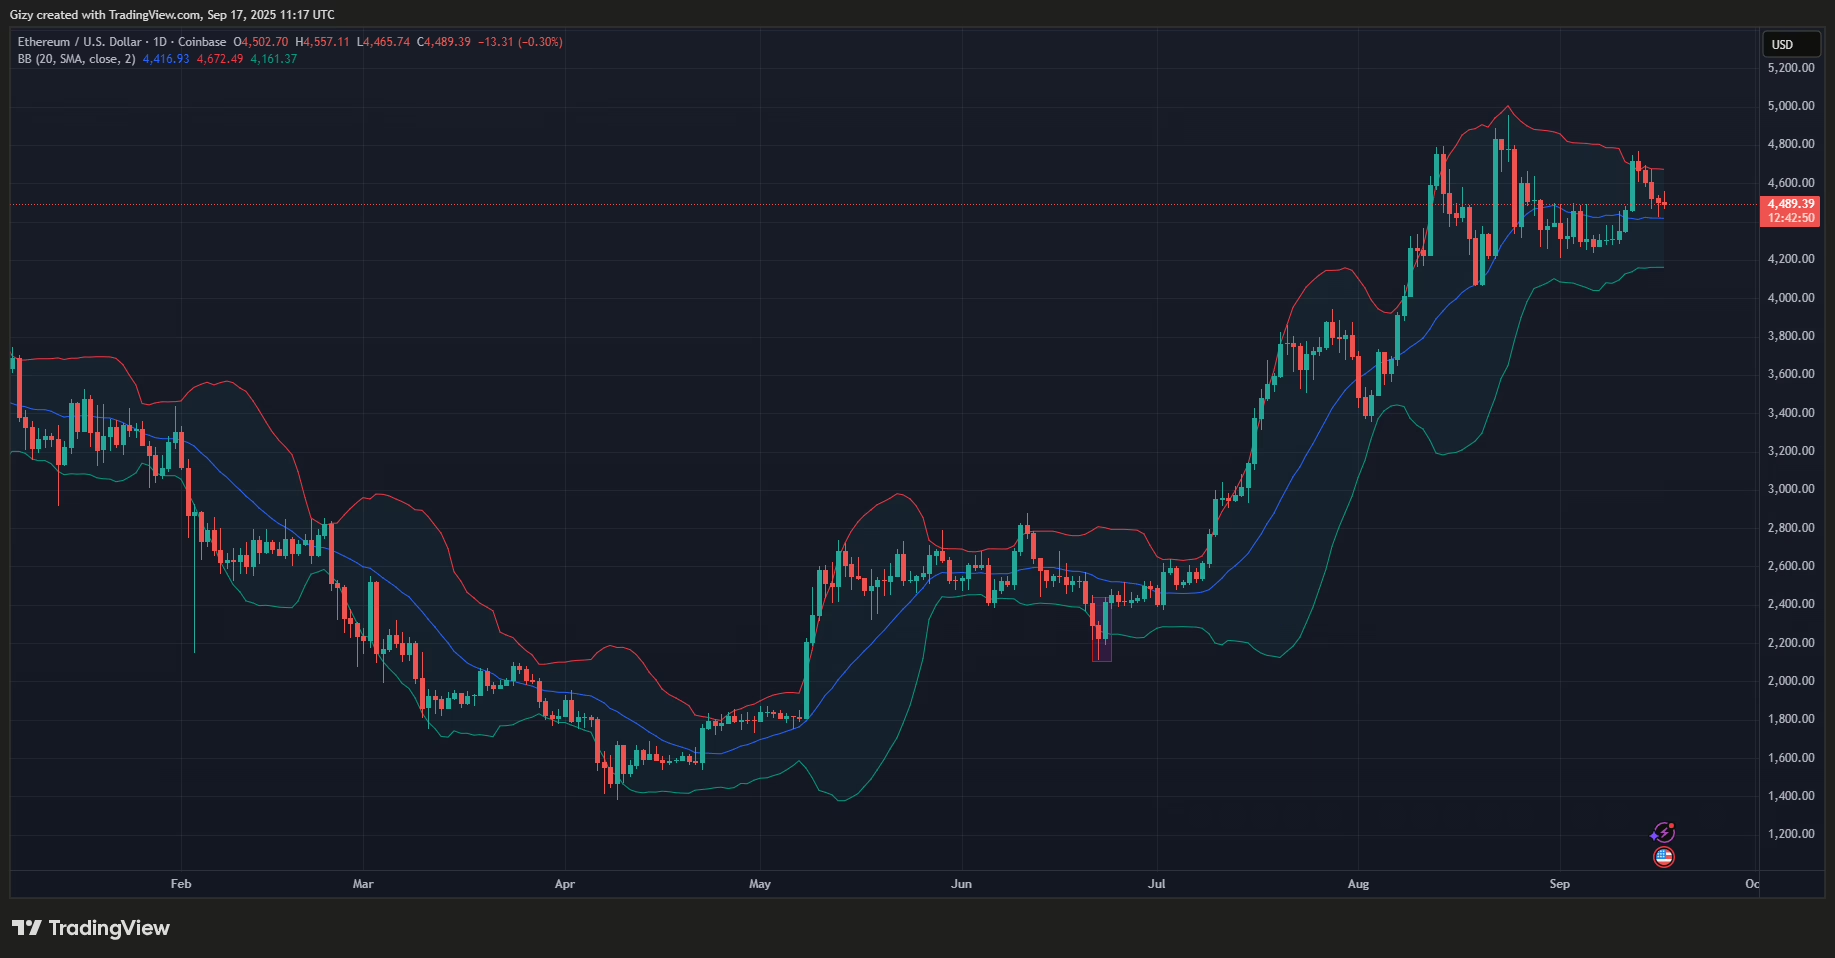
Nonetheless, the altcoin held onto a key level amid the gradual decline. A closer look at the 1-day chart shows that the retracement started after the coin broke above the bollinger bands. Although the trend is still ongoing, the asset maintains a price above the middle band.
Away from the charts, several onchain indicators reveal that investors are gearing up for a massive move in the coming hours.
Data from CryptoQuant shows that the altcoin is seeing significant accumulation. Exchanges are seeing a higher outflow over the last 24 hours, with outbound transfers reaching 1.13 million ETH. Conversely, selling pressure reduced, indicated by the 989k ETH inflow. As a result, exchange reserves are declining.
However, prices are yet to reflect the onchain trend as ETH continues its downtrend on Wednesday. It reached a high of $4,557 a few hours ago, but currently prints a red candle. The latest price action suggests an impending shake-out before the rate cut announcement. Investors are selling to lower the entry before the event in a bid to maximize profit.
Derivative Traders Are Less Optimistic
Generally, the derivatives market appears optimistic as long positions made up a little above 50% of the total open orders. However, this is not the case with Ethereum as shorters account for almost 52% of the total positions in the last 12 hours.
A breakdown of the unfolding trend reveals that most of the current volume is from Binance. This is significant because the exchange covers a massive number of small traders and may reflect what they expect will happen in the coming hours.
Additionally, derivative pressure can also reflect on price. It explains why ETH is struggling amid the drop in massive exchange reserves.
Nonetheless, one reason for this bearish outlook may be the chart. It is worth noting that Ethereum retraced after briefly breaking above the bollinger bands. It recently rebounded off the middle band but risks slipping below it.
Ethereum Eyes $5k
While traders’ behaviour in the derivatives market coincides with current price action, this may change. The ongoing price movement indicates a notable drop in spot volume compared to the perpetual futures.
A recent analysis noted that Bitcoin’s recent surge is being fueled by substantial ETF accumulation and optimism among futures traders. Institutional participation is also on the rise, with capital inflows steadily increasing. The article did not add the spot market as one of the movers due to weak volume.
The same trend is unfolding on Ethereum, but futures traders are bearish, and ETFs are also not positive. However, the impending fundamentals can alter this trend. ETH will surge higher if this happens and the charts agree.
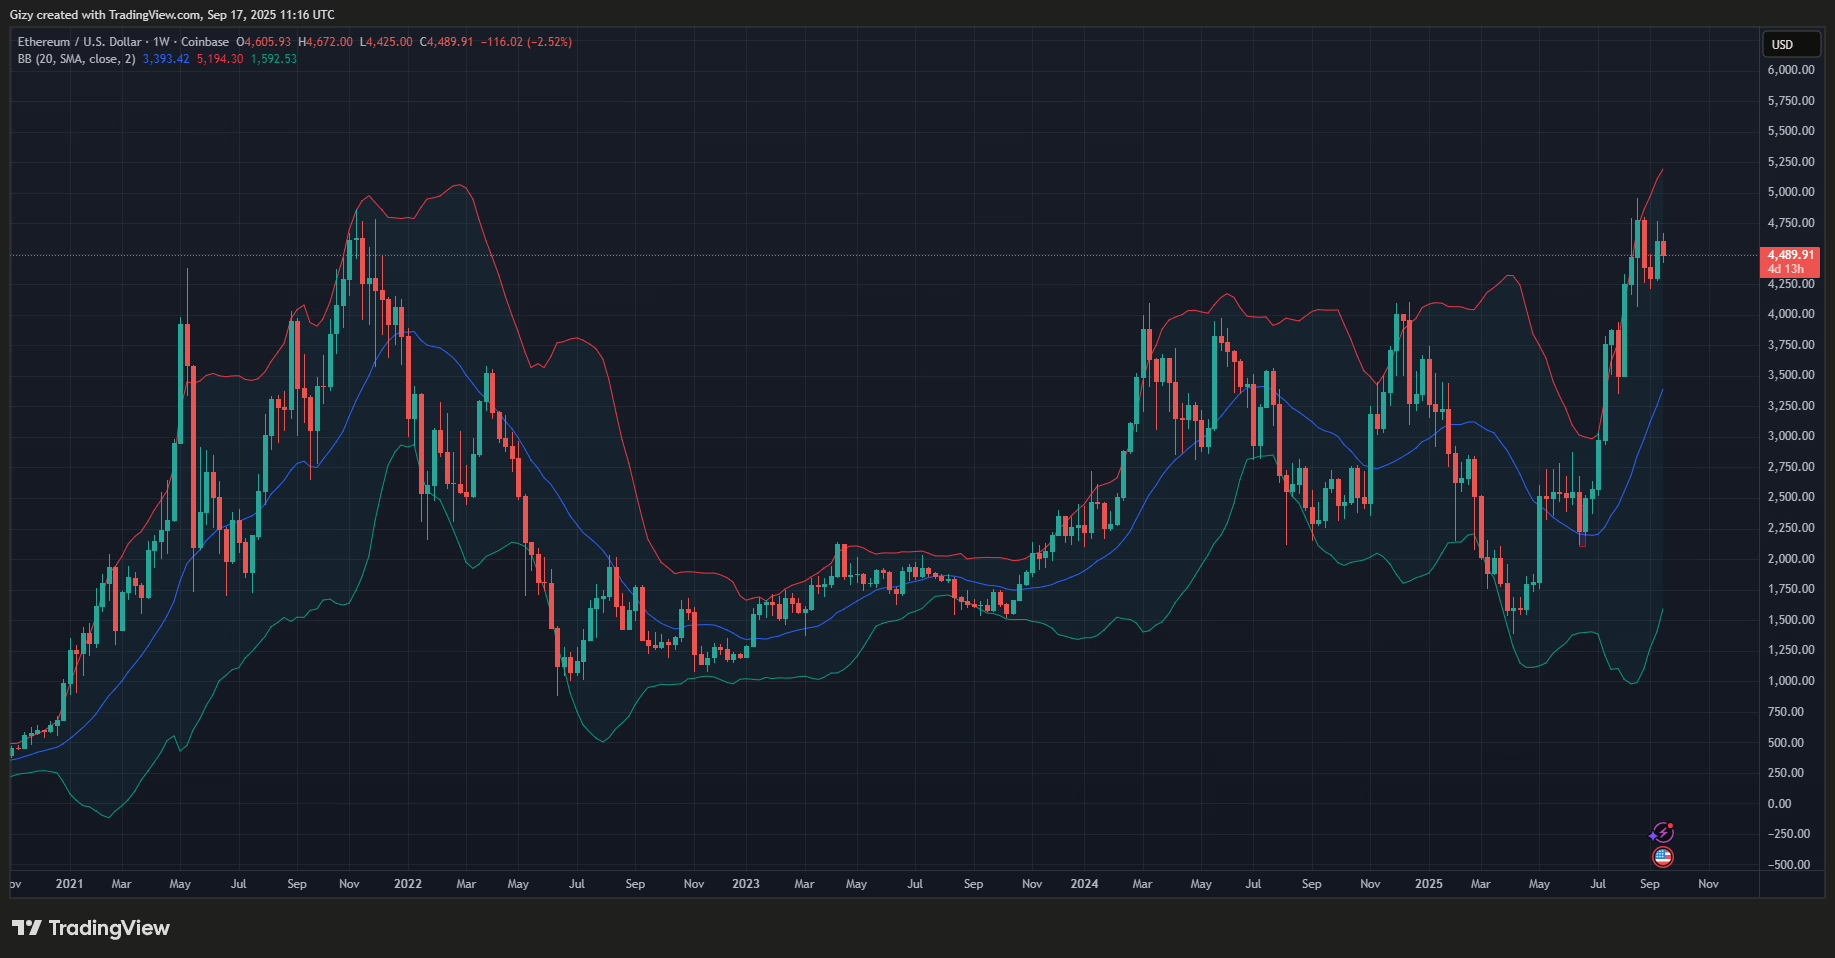
A closer look at the 1-day chart reveals that the bollinger bands are narrowing, suggesting an impending breakout. The 1-week chart indicates that ETH’s next target is $5k as the BB on this timeframe has its upper band at $5,300.
Nonetheless, Ethereum is experiencing an increase in trading volume, with the latest reading indicating an 18% rise.
Get Trending Crypto News as It Happens. Follow CoinTab News on X (Twitter) Now


