
Ethereum showed signs of recovery in the early hours of Friday, surging to a high of $4,671. However, prices took a turn for the worse.
The altcoin is trading at $4,400 at the time of writing, after slightly rebounding from its low. ETH is heading for another day of losses as it’s down by almost 3%.
The early gains sparked hopes of an ongoing recovery and a trend reversal from the previous day’s downtrend. Liquidation data shows that many shared this sentiment as traders lost over $370 million trading futures.
CoinGlass indicates that the bulk of the losses happened on ETH. It accounted for over $180 million in liquidated funds in the last 24 hours. Long positions were the biggest losers, accounting for over 75%. The trend is ongoing as the bulls suffered another massive wipeout in the last 4 hours.
The second-largest coin retraced to a low of $4,446 on Thursday following its failed attempt at the $4,800 mark. Ethereum ended the previous day with losses exceeding 4%. However, data from Santiment shows that the decline may be ending soon.
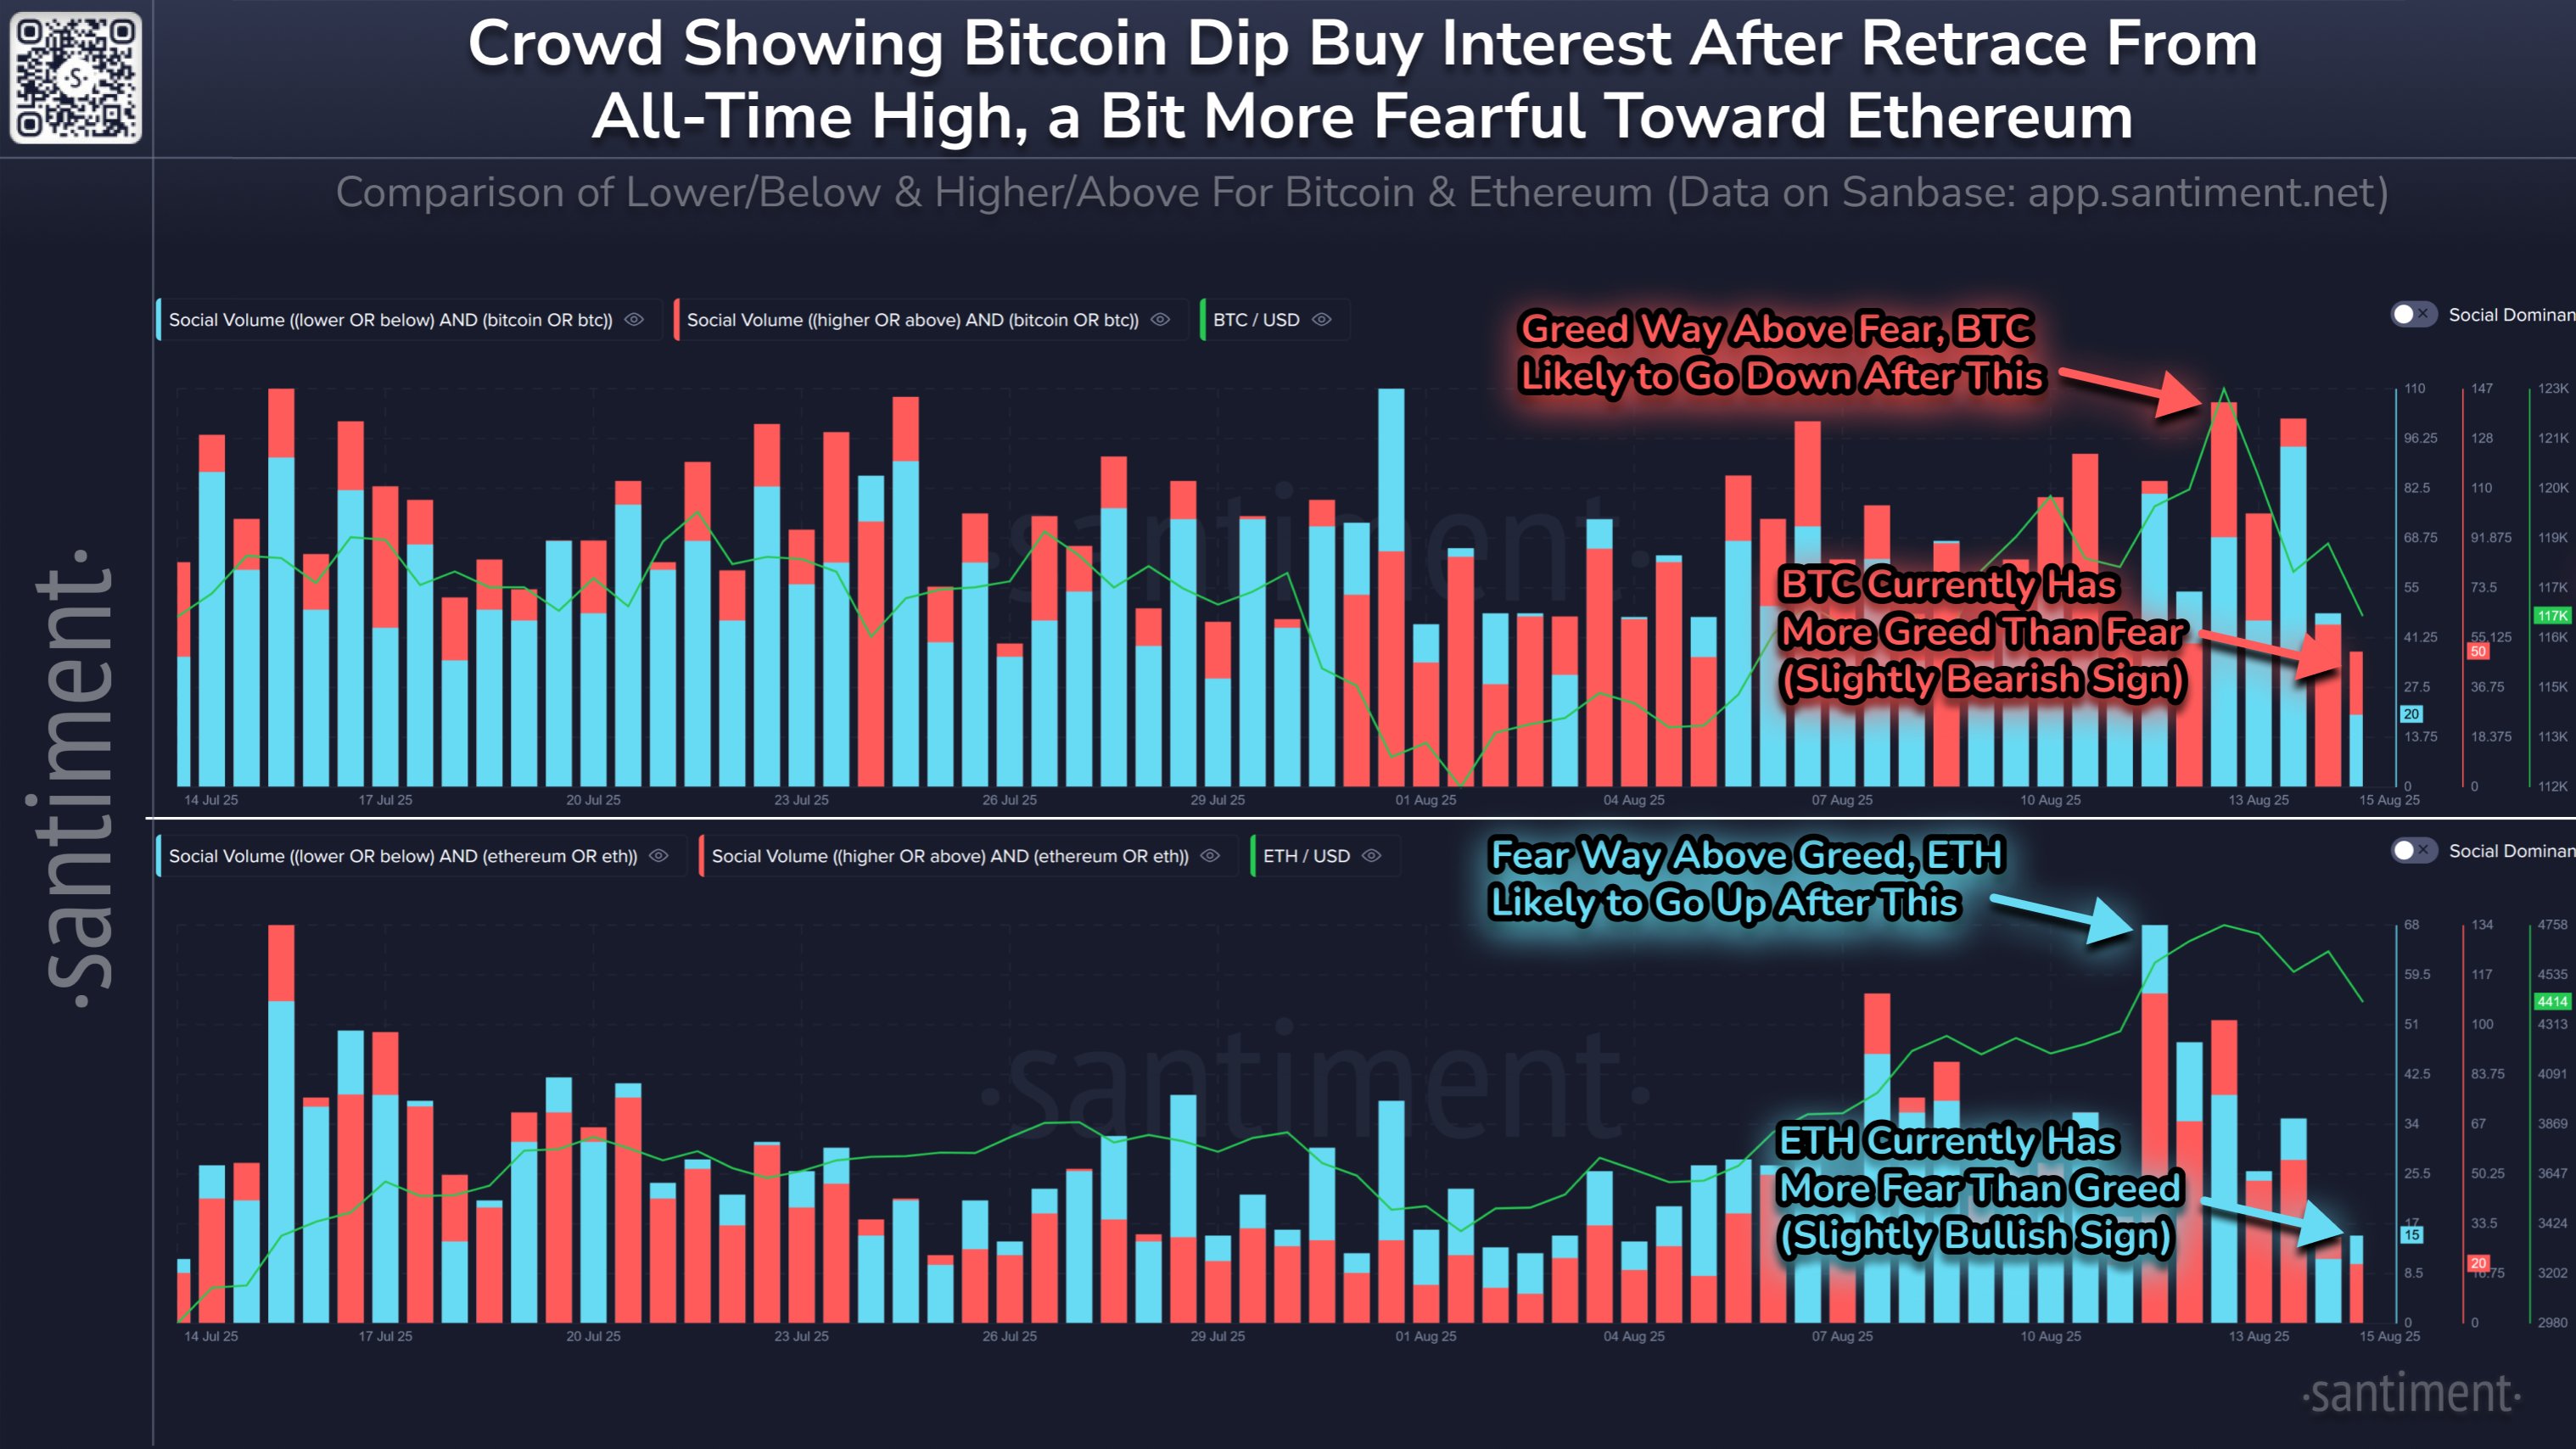
The chart above indicates that the altcoin is not gaining massive attention from investors. The clamor for higher prices is significantly low, which indicates signs of less greed among investors. Historically, prices move in the opposite direction of crowd sentiment. This means that the coin has a higher chance of surging higher.
Why Is Ethereum Still Dipping?
Ethereum continues its descent on Friday as trading conditions remain bearish. It is yet to shrug off the cause of the previous day’s decline.
One such factor responsible for the previous day’s dip was the US PPI report. It came out higher than expected, suggesting that inflation is climbing again. The sight of rising inflation spread panic across the market.
Aside from fundamentals, the altcoin retraced after failing to flip the $4,800 resistance. Thursday’s attempt will mark its second trial at the mark. Previous price movements indicate a massive selling congestion around the mark.
Indicators on the 1-day chart give another reason for the ongoing decline. The relative strength index was at 79 on Wednesday; ETH is overbought. The decline is the much-needed correction.
Is a Rebound at Hand?
Major indicators on the 1-day chart display no signs of an impending trend reversal. RSI is at 65, which is considered neutral. However, readings on the moving average convergence divergence show that the asset may be heading for further declines. The 12-EMA is arched downward as it starts a bearish convergence. A crossover would herald more downward momentum.
Indicators on the 1-day chart depict a similar scenario. The relative strength index is at 42. Previous movement suggests a reduced likelihood of rebound happening at this level. Nonetheless, the chance of this happening is not zero, as it occurred in July.
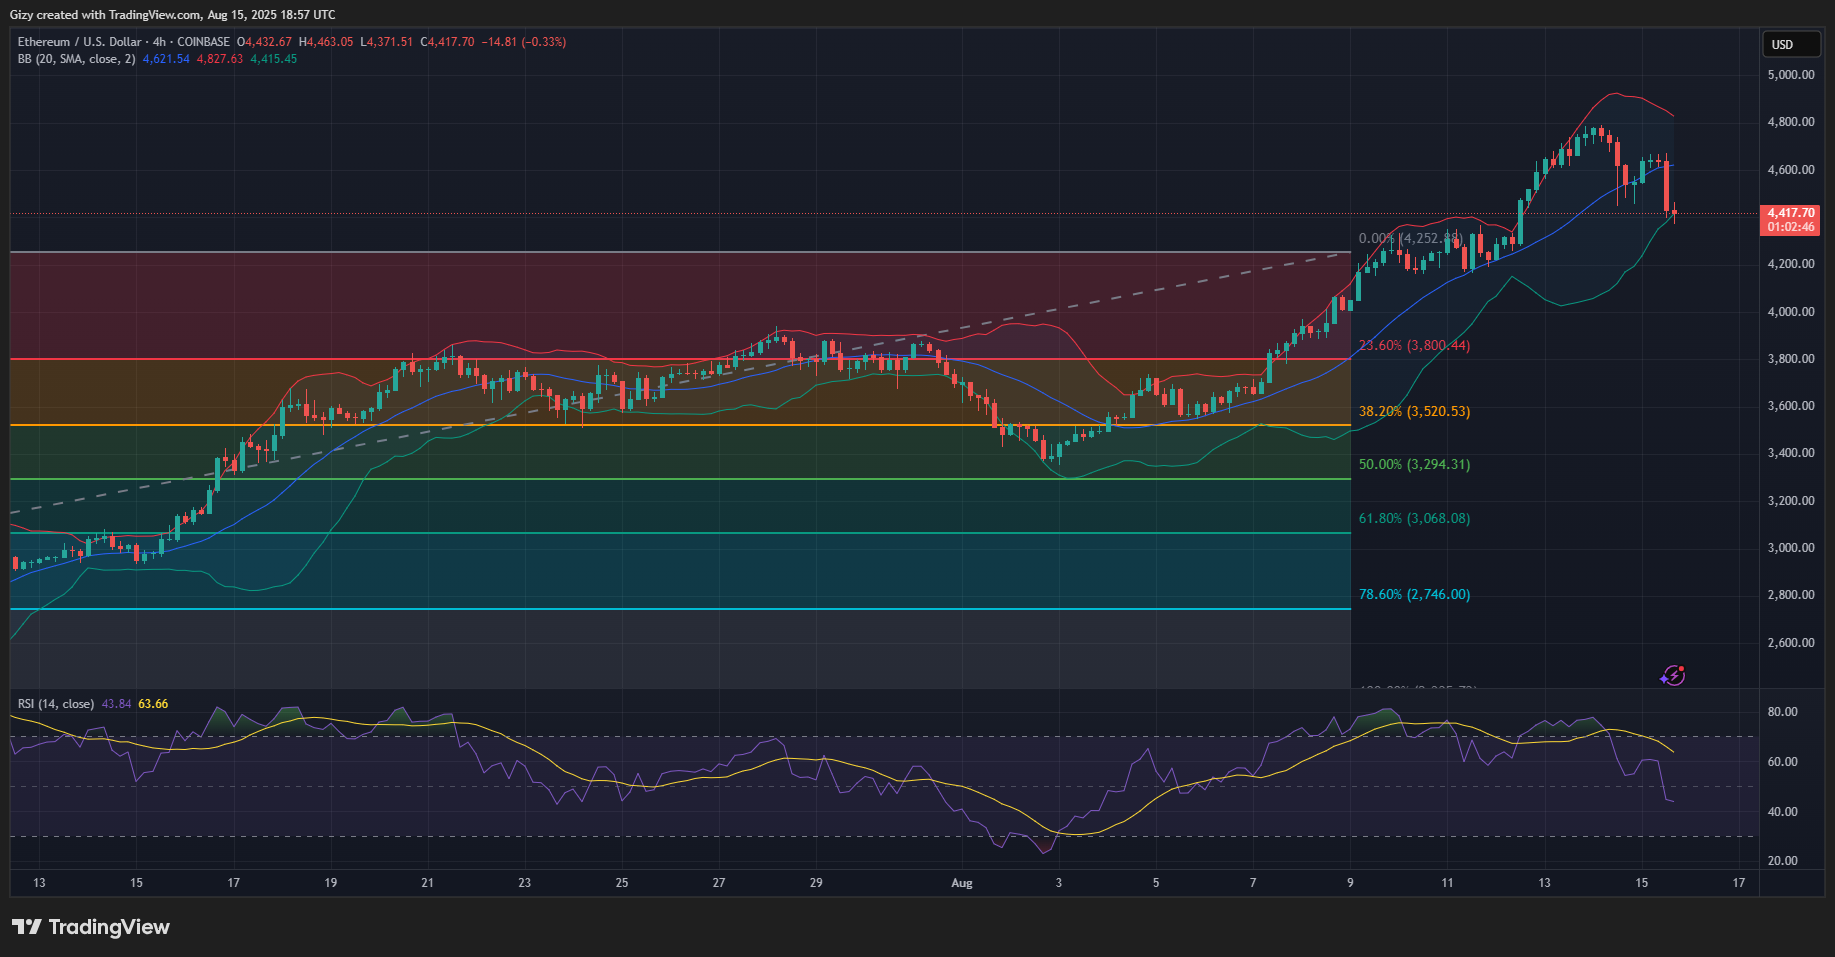
The bollinger band paints a more positive image of how prices may play out. It is worth noting that Ethereum is trading at the lower band, indicating an impending rebound. The trend reversal may be a reality as the coin’s current candle is a doji.
ETH briefly broke below the lower band but recovered and trades above it at the time of writing. The candle may point to growing attempts by the bulls to stage a massive buyback. However, chances of a sharp uptick that will wipe out all incurred losses may not happen this week.


