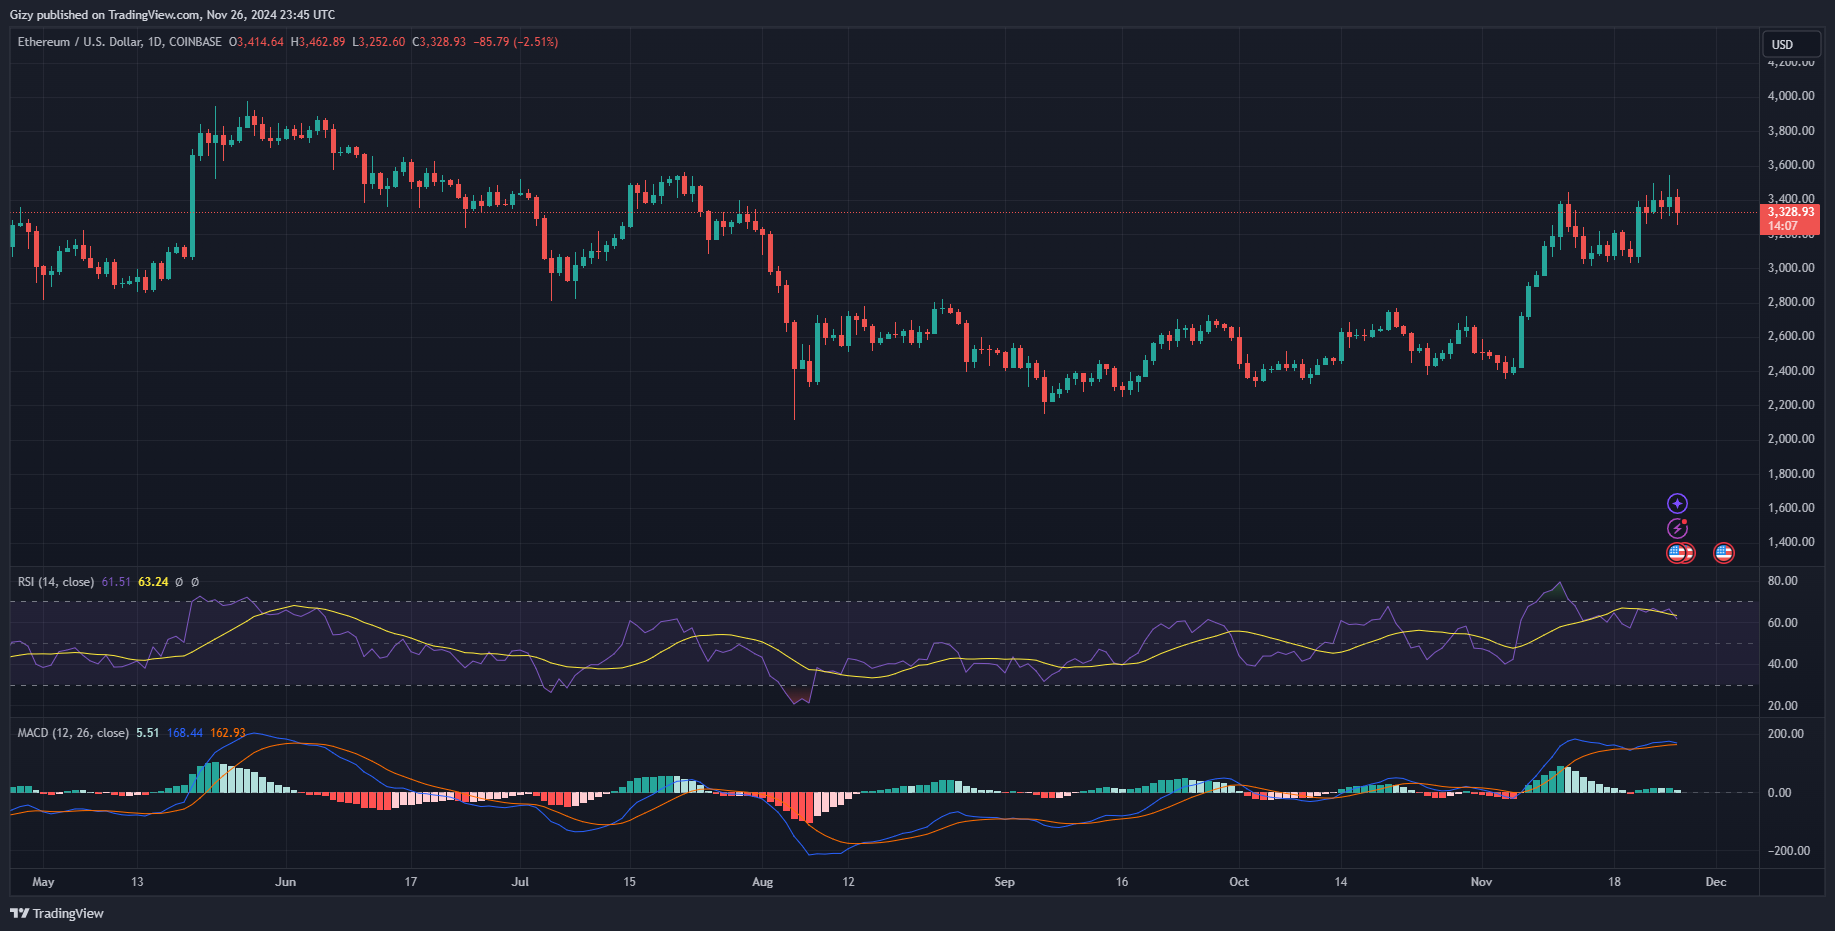
Ethereum currently grapples with significant selloffs at the time of writing. The largest altcoin was barrelling down several price marks before finding support.
It opened trading at $3,414 and edged closer to $3,500 but failed to break it. It retraced after hitting a high of $3,462, dropping to a low of $3,252 before rebounding. Although it’s recovering, it is down by almost 3%, and fear of further declines rises.
It is worth noting that the latest declines started after the altcoin attained its highest valuation over the last three months. It climbed to this height during the previous intraday session when it opened trading at $3,365 and surged to a high of $3,546.
ETH was previously on the verge of a major decline but had a sudden spike in buying pressure on Thursday. It had its biggest surge, gaining over 9% after surging from $3,000 to $3,390. It remains to be seen if the same will happen this time. Nonetheless, onchain indicators are currently bearish. Let’s examine the force behind the previous day’s increase.
Massive Large Transactions
The largest altcoin enjoyed massive demand concentration during the previous intraday session. The driver behind the uptrend is large transactions. They significantly increased from 5921 to 10464, almost doubling. Total exchange netflows increased from—$33 million on Nov. 24 to $89 million during the previous intraday session.
Conditions have significantly changed. The asset sees a more than 6% decline in trading volume as the bears seize control of the market. ETH is bearish on several fronts. For example, exchange reserves are on the rise over the last 24 hours. The exchange netflow is currently green as these trading platforms received 100% more coins than the previous day.
The growing netflow shows an ongoing selloff. The Ethereum ecosystem is seeing a drop in activity as active addresses significantly dropped.
ETH grapples with massive selling congestion from the US. Traders in this region are increasingly pessimistic, as indicated by the negative Coinbase Premium. Nonetheless, other regions like South Korea remain as seen on the Korea premium. Spot ETFs are also witnessing significant inflow amidst the ongoing trend.
The negative sentiment spread into the derivatives market, as open interest dropped by over 3% in the last 24 hours. Nonetheless, the bulls continue opening new positions and adding more funds to their existing stance. There is a huge selling sentiment in those sectors as more sell orders are filled. Long position holders lost over $95 million in liquidations.
Onchain indicators like the relative strength index are stochastic and neutral, indicating mild selling pressure.
Ethereum Risk Drop Below $3,200
ETH dropped to a low of $3,250 a few hours ago, showing notable pressure on the $3,200 support.
The moving average convergence divergence shows sell signals at the moment of writing. After several days of steady drops, the 12-day EMA made a bearish divergence and intercepted the 26-day EMA. The most recent MACD signal suggests more declines.

With more selling pressure, the momentum indicator is dropping. The average directional index is declining as a result of earlier measurements. The A/D data shows that accumulation has drastically decreased during the past 48 hours.
The bearish readings suggest growing pressure on the highlighted support. If trading conditions remain the same, ETH may lose this critical level.
