
Ethereum dipped by over 6% in the last 24 hours. The latest drop saw the coin edge close to the previous month’s low as it briefly flipped $3,400. It dropped from $3,671 to $3,381.
The altcoin’s latest move follows a breakout from a range-bound movement that lasted over seven days earlier this month. During this period, it trended between $3,700 and $3,900 as it constantly faced massive rejection of its bids to break $4,000.
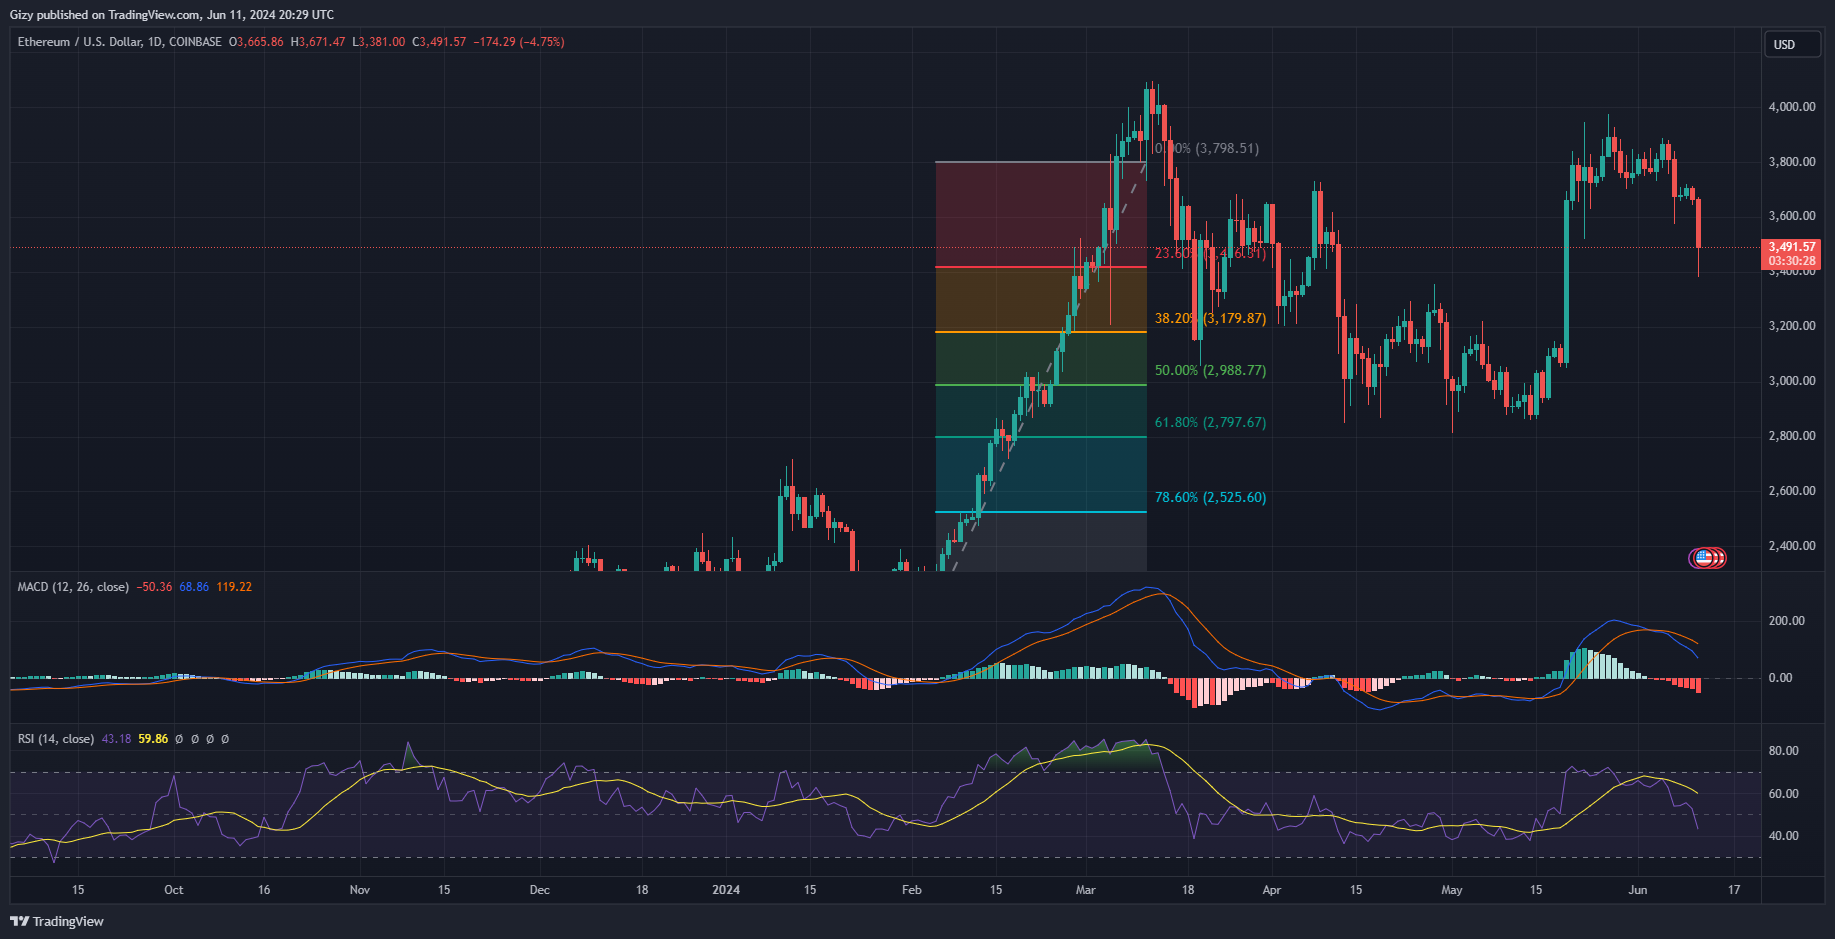
Following an almost 4% decline on June 7, ETH lost the $3,700 support but rebounded at $3,500. It remained above this crucial level for over three days before the most recent decline.
The fresh downtrend comes as no surprise, as the chart pointed out on June 5. The moving average convergence divergence on Friday flipped bearish. The metric printed a bearish divergence following almost three days of the 12-day and 26-day EMA trending very close to each other. During this period, the bulls and bears failed to exert intense pressure on the coin due to very low volume.
The low trading volume translated to the asset’s low volatility over the last three days. Many expect massive price movements following the launch of ETH EFTs. However, the most recent shows that the reverse is the case.
In reaction to the latest dip, the relative strength index drops lower. It is at 42 at the time of writing after a drop from 55. The slip below 50 further adds to the claims of bearish dominance.
Solana Loses Over 6%
Solana was not exempted from the day’s bearish sentiment. It lost over 6% in the last 24 hours as it edged close to the previous month’s low. It retraced from $158 and rebounded at $144.
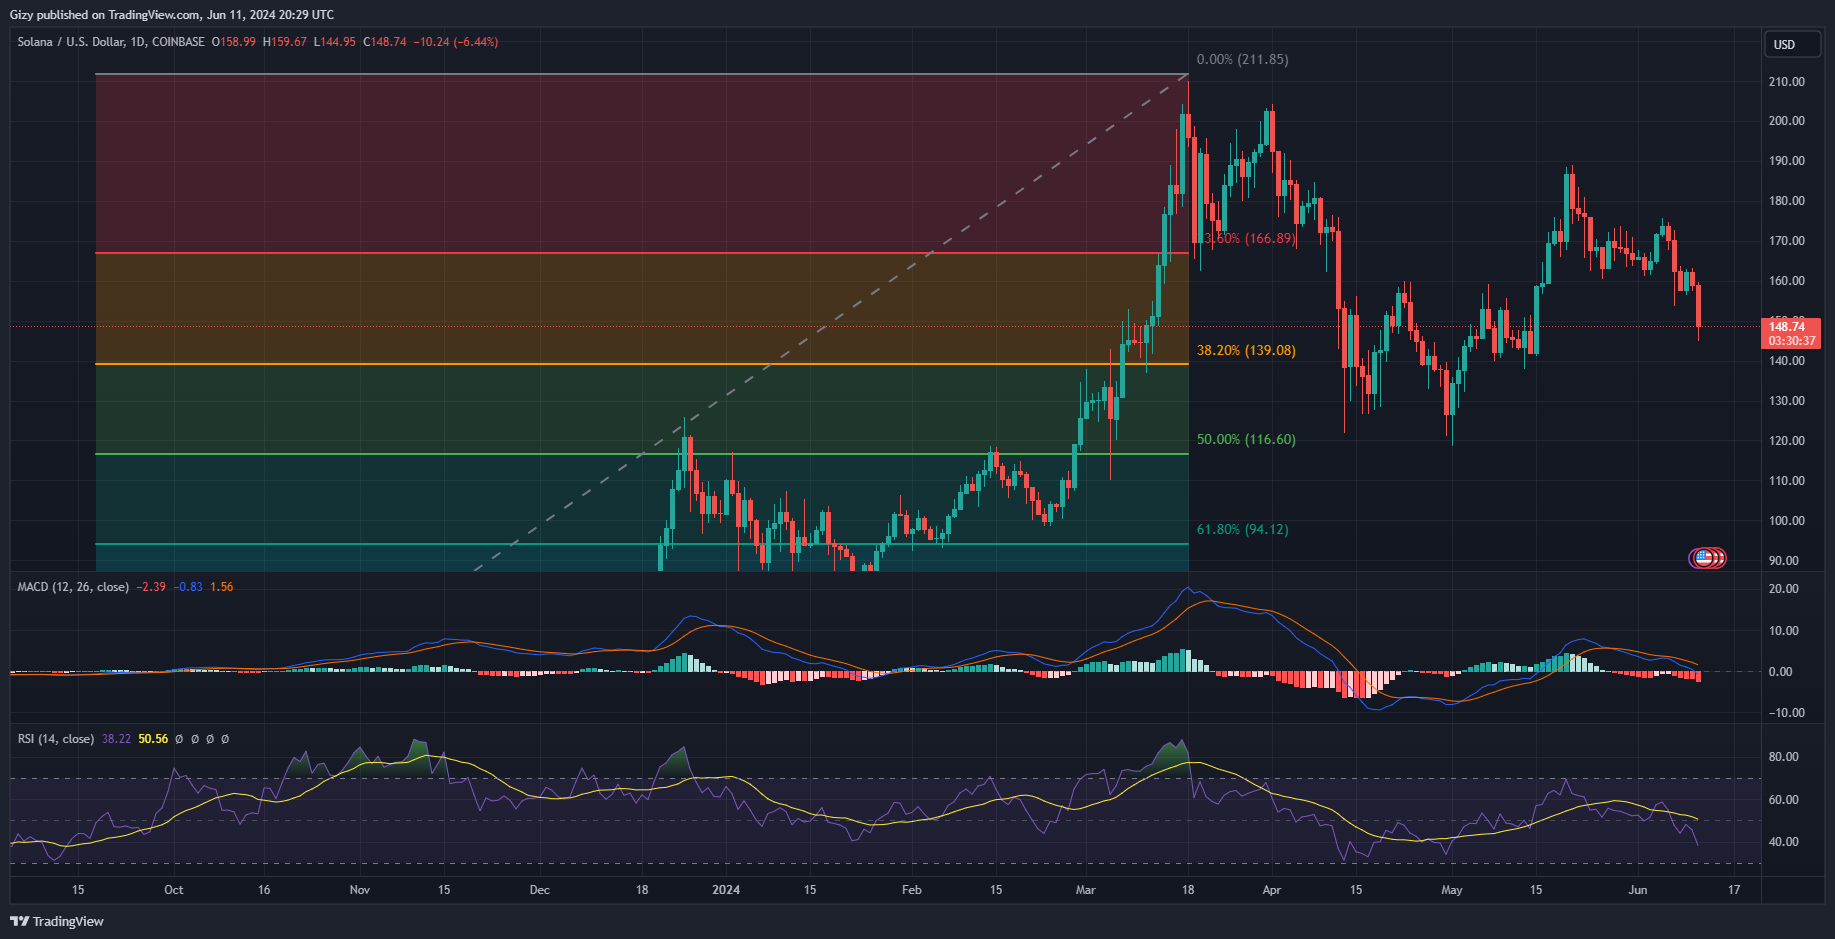
The coin is trading at $148, which puts it at risk of testing the $140 support. Nonetheless, many expect further surges from now on.
The latest downtrend is a breakout from the asset’s previous price trend. It was range-bound over the last three days as it maintained trading between $157 and $163. The range movement follows Friday’s decline, which saw the altcoin drop from $172 to a retest of the $160 support. It lost the critical level and fell to a low of $153. Although it rebounded and reclaimed $160, it closed with losses of over 4%.
While there are speculations of impending recovery, this is not the first time the asset has seen such price movement. From May 25 to June 7, SOL failed to breakout from the horizontal channel it created. It traded between $170 and $160 before it lost a crucial mark.
Nonetheless, the latest dip is a continuation of the bearish dominance MACD hinted at on May 27. The metric displayed a negative divergence as the 12-day EMA dropped below the 26-day EMA. The latest downtrend sees the indicator slip lower with no signs of recovery.
RSI suggests that the bears are having a field ‘week’ on SOL as it sinks lower. It started the day at 45 but is trending at 37. Currently below 50, it places the sellers at an advantage.
The memecoin frenzy failed to shield Solana from the constant declines it is experiencing. It has lost over 20% since May 21 and shows no signs of halting.
Feds’ Interest Rate Cut Unlikely
The crypto market rode on waves of impending interest rate cuts in July. Other Wall Street giants share the same sentiment, as several metrics, like May’s jobs report and CPI, show slowing inflation.
However, the financial institution withdrew its prediction following July 7’s job report, indicating a decline in the progress that once thrilled it. Due to this, Citibank also announced its reservation of any rate cuts this month.
Nonetheless, some economists and other professional Fed watchers now anticipate one or two rate cuts in 2024. The prediction is that it will happen in either September or December.
