Ethereum is experiencing a massive decline at the time of this writing. The one-day chart shows that the bearish trend started during the previous intraday session when the asset registered a notable price drop.
The previous started with prices at $2,537 but retraced after a small hike. It dropped to a low of $2,410 and closed with losses exceeding 4%. The asset fully erased Monday’s profit and is yet to halt the downtrend as it broke yet another critical level.
Ethereum is trading at $2,386 following a brief decline retest of the $2,300 support. The candle representing the current price movement shows attempts at recovery.
What Caused the Dip?
The global economy is currently in turmoil as many fear an impending global recession that will sweep through every sector. They are panicking and selling off their assets to hedge the incoming ‘great depression.’
News of the Japanese Federal Reserve hiking up interest rates further spread the growing fear, resulting in the US stock market losing over $1 trillion during the previous intraday session.
The top loser went to Oruka Therapeutics, Inc, with a daily loss of 92%. Windtree Therapeutics, Inc., 60%, likewise declined sharply, and Faraday Future Intelligent Electric Inc. fell more than 30%.
Even large stocks suffered, too—Apple Inc. was down about 3%, and Microsoft Corporation had lost nearly 2% as well. The top 10 hardest hit was NVIDIA Corporation, which posted a nearly 10 percent loss over the past day.
Other fundamentals were also responsible for the decline. One report claimed that U.S. antitrust officials are worried that NVIDIA might be penalizing buyers who use its computer chips with products from other chip makers.
The firm’s shares plunged after reports that the Department of Justice had sent Nvidia and other companies a subpoena as part of an investigation into possible violations of U.S. antitrust laws.
How On-chain Metrics Are Reacting
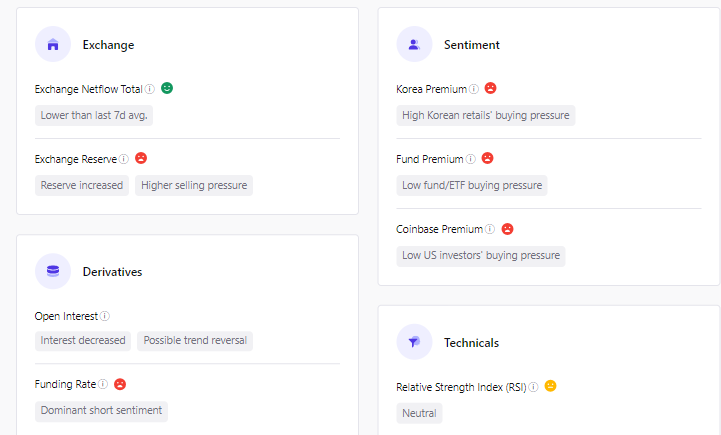
On-chain data are still bearish amidst the ongoing trend. Exchange Netflow is increasing as traders are moving funds from cold storage to other trading platforms, indicative of an ongoing selloff. Exchange reserves are also increasing as the asset is seeing less buying volume.

The negative reading extends to other aspects of the market. The general sentiment from major market is bearish. For example, the Asian market is seeing more out from the crypto market.
US investors are also shying off from investment. A clear indication of this is the drop in funds going into Coinbase. As a result, the Coinbase Premium is negative. The same trend is present in crypto products as ETFs continue massive outflow.
The derivatives market is also seeing the bearish trend as funding rates drops. Open interests are also significantly low.
How Ethereum Is Reacting
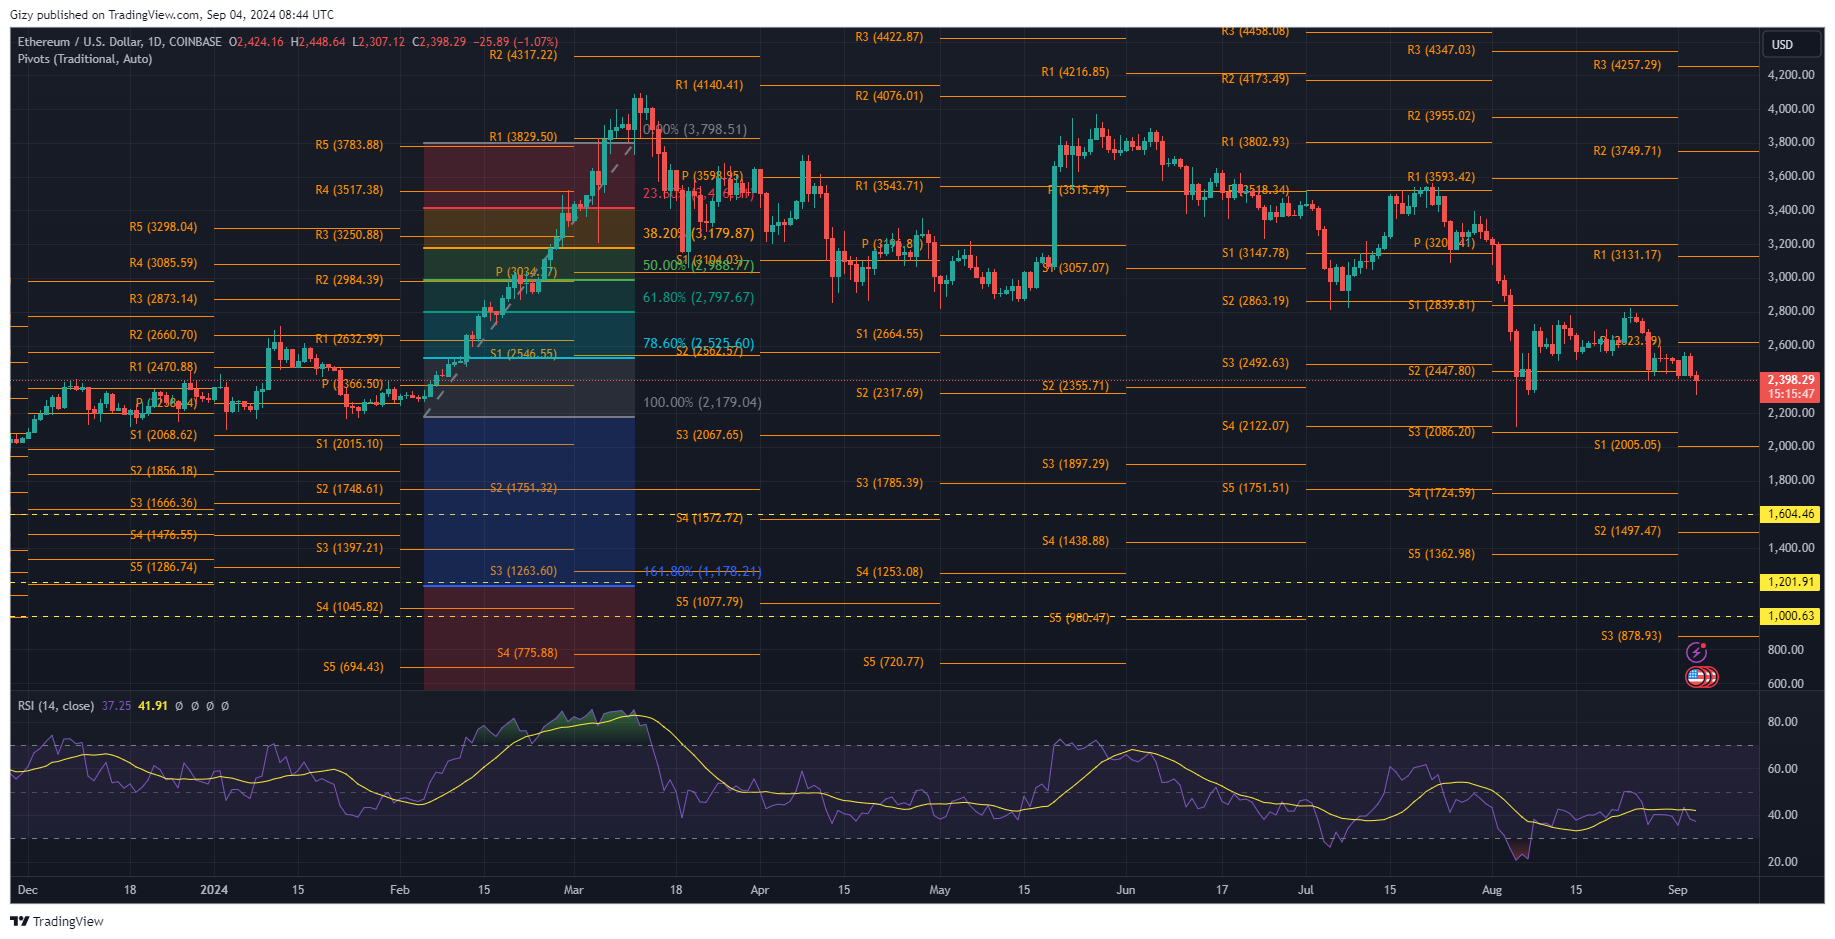
All indicator on the 1-day chart are bearish. The moving average convergence divergence is currently trending downhill, indicating the continuation of the price decline.

The relative strength index is also trending downwards, indicating small drops in buying volume. It also explains the reason for the most recent decline.
With all indicators, on-chain and on-chart showing that the asset will continue it downtrend, how low will it go?
It is worth noting that Ethereum is trading close to its pivot point at $2,623. Since losing it, the apex altcoin failed to reclaim it due to several selling congestion.
ETH is at risk of dropping as low as $2k in the coming days. It could rebound off the first pivot support at this mark.
The Fibonacci retracement level points to the coin dipping below the 78% mark. The chart suggests that a drop to $2,100 is almost inevitable.
It is important for the bulls to defend the 100% Fib level at $2,170. Failure to do so will result in a drop to S2 at $2k. Breaking this critical level will result in a dip to $1,900,
