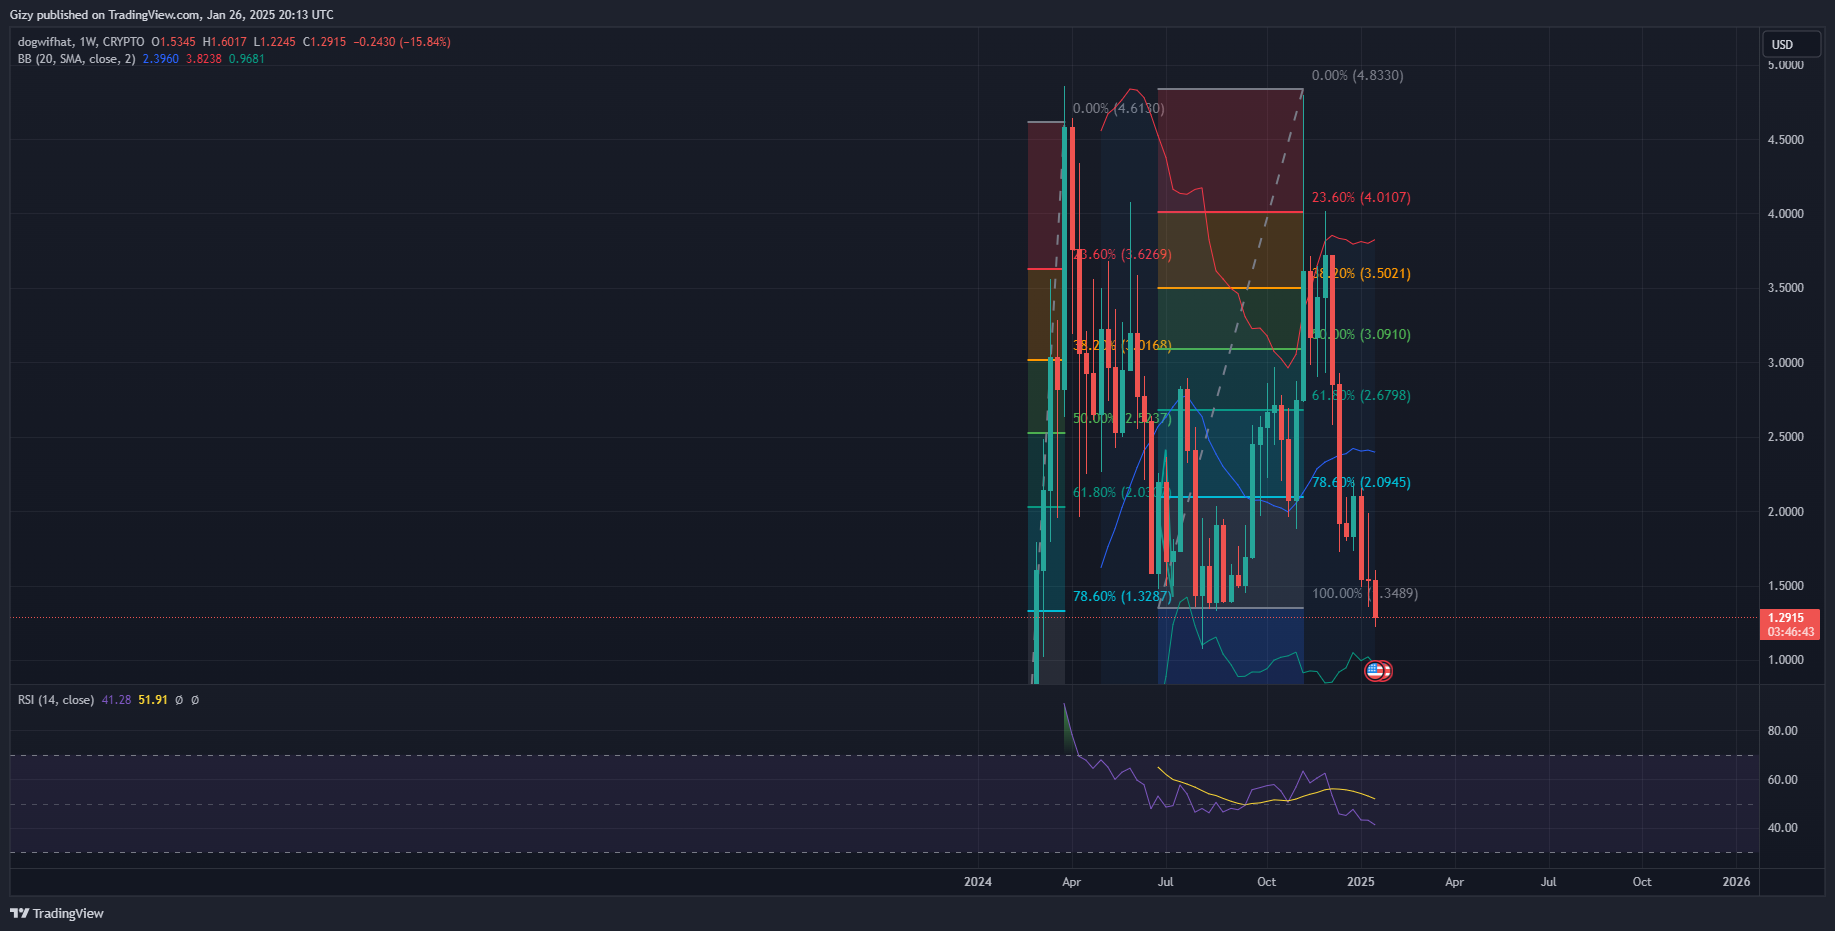
Dogwifhat is printing a green candle at the time of writing. Although it is a doji, maintaining this feature until the session ends may mark its first green after four days of consistent downtrends.
WIF has been in a downtrend for weeks, and many traders have lost interest. Since the first half of December, the asset has not registered any significant upside movement. It continues downward, with short breaks in between.
The memecoin slipped down the market cap rankings and sits at the 80th spot. Further declines may send it lower or out of the top 100s. Several users claimed that the reason for the token’s decline is poor tokenomics. They joked, “Who gives a memecoin a starting price of $1.”
Dogwifhat returned to levels it surged above in February 2024. The decline is ongoing, and investors are wondering when it will end.
WIF Dips Below August’s Low
The memecoin started the week at $1.53 and surged as the crypto market rode the wave of the new US president and surged to a high of $1.60. Since the news faded, the altcoin experienced notable dips. The previous day’s decline saw it hit a low of $1.22.
This is the first time cryptocurrency has hit this level since August. Nonetheless, it is worth noting that the current price trend mimics the previous declines. Dogwifhat attained an all-time high during the last week of March. The asset experienced notable price declines afterward.
The memecoin lost over 50% in the following four weeks. The downtrend halted for some weeks as the prices remained rangebound. However, it experienced a small price increase during the last two of May. The uptrend abruptly ended in the first week of June, resulting in a decline to $1.07 in August.
Similarly, WIF surged to a new all-time high in November and lost 24% in the same week. It retraced lower the following week, losing 12%. Although the bulls tried continuing the uptrend, the downhill movement continued in the second week of December and has since trended downwards.
Although the latest decline sees the asset hit fresh lows, previous price movement suggests that the downtrend may end soon.
Dogwifhat May Rebound
A closer look at the chart reveals that the first sign of recovery is the asset’s rangebound behavior. It remained between $1.30 and $2 through August and the first two weeks of September before breaking out.

The same trend may play out in the coming days. WIF may trade within a channel for an extended period before breaking out. However, the asset is not clear from the danger zone. The one-week chart shows the relative strength index dipping to lower levels than previously seen. At the time of writing, the RSI is at 41, indicating lesser buying pressure.
The Bollinger band shows the asset dipping to its lower SMA. As with the August dip, the asset may test this level. This means that the altcoin will lose its $1 status before rebounding and may dip as low as $0.96.
The one-day chart shows that WIF may become oversold if the downtrend continues. The RSI is currently at 32. Nonetheless, the Bollinger band on this timeframe shows that a rebound may come earlier than expected. The token may trend between $1.30 and $2 before it breaks out.
