
Dogecoin experienced a significant decline on Friday, down by over 3% at the time of writing. It retraced from $0.127 and retested the $0.120 support.
Nonetheless, current prices suggest the asset held the support and is trading slightly higher. A closer look at the 1-day chart shows that this is not the first time it has tested the barrier. A similar event played out last week, when the coin briefly flipped it.
However, it rebounded shortly after. The same trend is unfolding as prices pull back. Trading actions during the previous seven-day session showed a significant surge on Friday after breaking the support. A surge may not occur this time, as the market grapples with notable selling pressure.
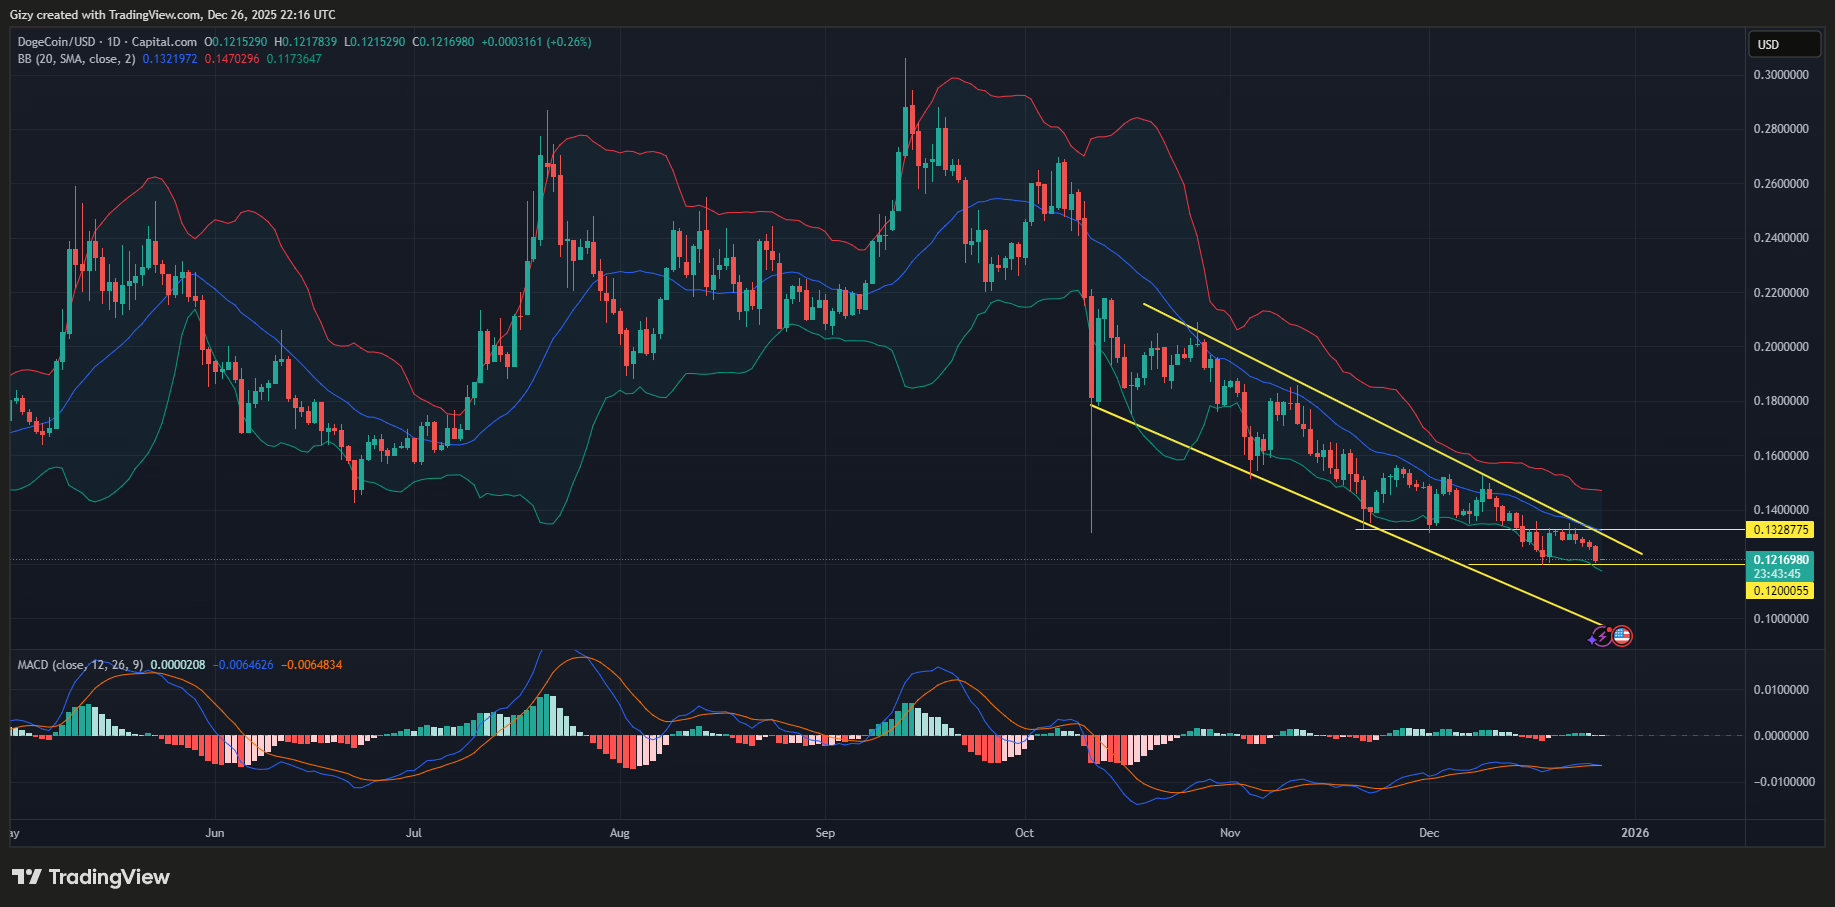
Nonetheless, while the asset struggles to resume its uptrend, a bigger trend is unfolding. The 1-day chart above shows the asset trading below a descending channel. It tested the support and resistance and has not changed the bearish structure.
The most recent breakout attempt occurred on Monday, when it peaked at $0.134 before retracing. It has since been in decline, worsening on Friday. However, the asset must surge in the coming days as a slip below $0.120 could result in an even steeper downtrend.
Previous Similar Slip
Dogecoin tested $0.132 for the first time since Oct 10 on Nov 21. It rebounded shortly after, gaining over 16% over the next few days. It retraced and tested the mark (a support at the time) 10 days later, but bounced off it.
The barrier finally gave way on Dec 13, and DOGE has since struggled to reclaim it.
Applying the same precedent to the current support, this is the second time the asset is testing the level. It must rebound as failure could result in further decline.
However, a closer look at the chart reveals a symmetrical triangle, suggesting a high likelihood of a range-bound market before a breakout. Nonetheless, the asset’s current trend may flip next week.
The moving average convergence divergence suggests the asset may retrace further. A closer look at the indicator shows the 12- and 26-EMA lines heading toward an intersection. A bearish crossover may happen within the next 24 hours if the buyers fail to stage a strong rally on Saturday.
In the event of a divergence, the memecoin will plummet even lower. The last time it decisively flipped the $0.12 support, it continued downward until it broke below $0.10. There was no intense demand concentration at $0.11 during this period.
A repeat of this event will see DOGE retrace as low as $0.095 by January.
Dogecoin 1-week Chart Agree
Dogecoin is down by almost 6% this week. A bearish close would mark the asset’s fourth consecutive week of decline, bringing its cumulative loss to over 19%.

The altcoin continues in its downward movement, which the Bollinger bands warn could result in a slip below $0.10. Currently trading at $0.12, the lower band is at $0.10, suggesting a possible drop to that level if the bulls fail to stage a buyback in the coming days.
Additionally, the relative strength index broke below a level it had hovered at and rebounded from on several occasions. Currently at 35, the downtrend may continue until Dogecoin is oversold.
Based on the price trajectory, the coming week will decide if DOGE drops below $0.10 by January or continues upward.
Get Trending Crypto News as It Happens. Follow CoinTab News on X (Twitter) Now


