The week started with so much anticipation as several events lined up that could push XRP and the rest of the crypto market higher.
Several fundamentals rocked the market this week. The biggest stimulus was released by the Chinese central bank. The regulator announced interest rate cuts and promised further policies to encourage investors.
The action yielded results, as China’s stock exchange stopped its downtrend. Several assets on the exchange surged by over 20%, with the largest gainer seeing most 30%. The rallies signified investors’ growing confidence as they flooded the market, buying several stocks. Buying actions were at their peak, as many analysts said the last time the CSE saw such inflow was in 2008.
The crypto market also experienced its fair share of the bullish trend as several cryptocurrencies surged. The global cryptocurrency market cap reached above $2.30 trillion. Let’s see how some assets in the top 10 reacted.
BTC/USD
Bitcoin is printing its first red candle in the last three days. However, this is not the only loss of the week, as the asset lost almost 2%. It saw a recovery on Thursday, erasing the previous day’s losses. It started the day at $63,121 but surged and reclaimed $65k. BTC also attempted the $66k resistance but failed as it faced notable rejections at $65,800.
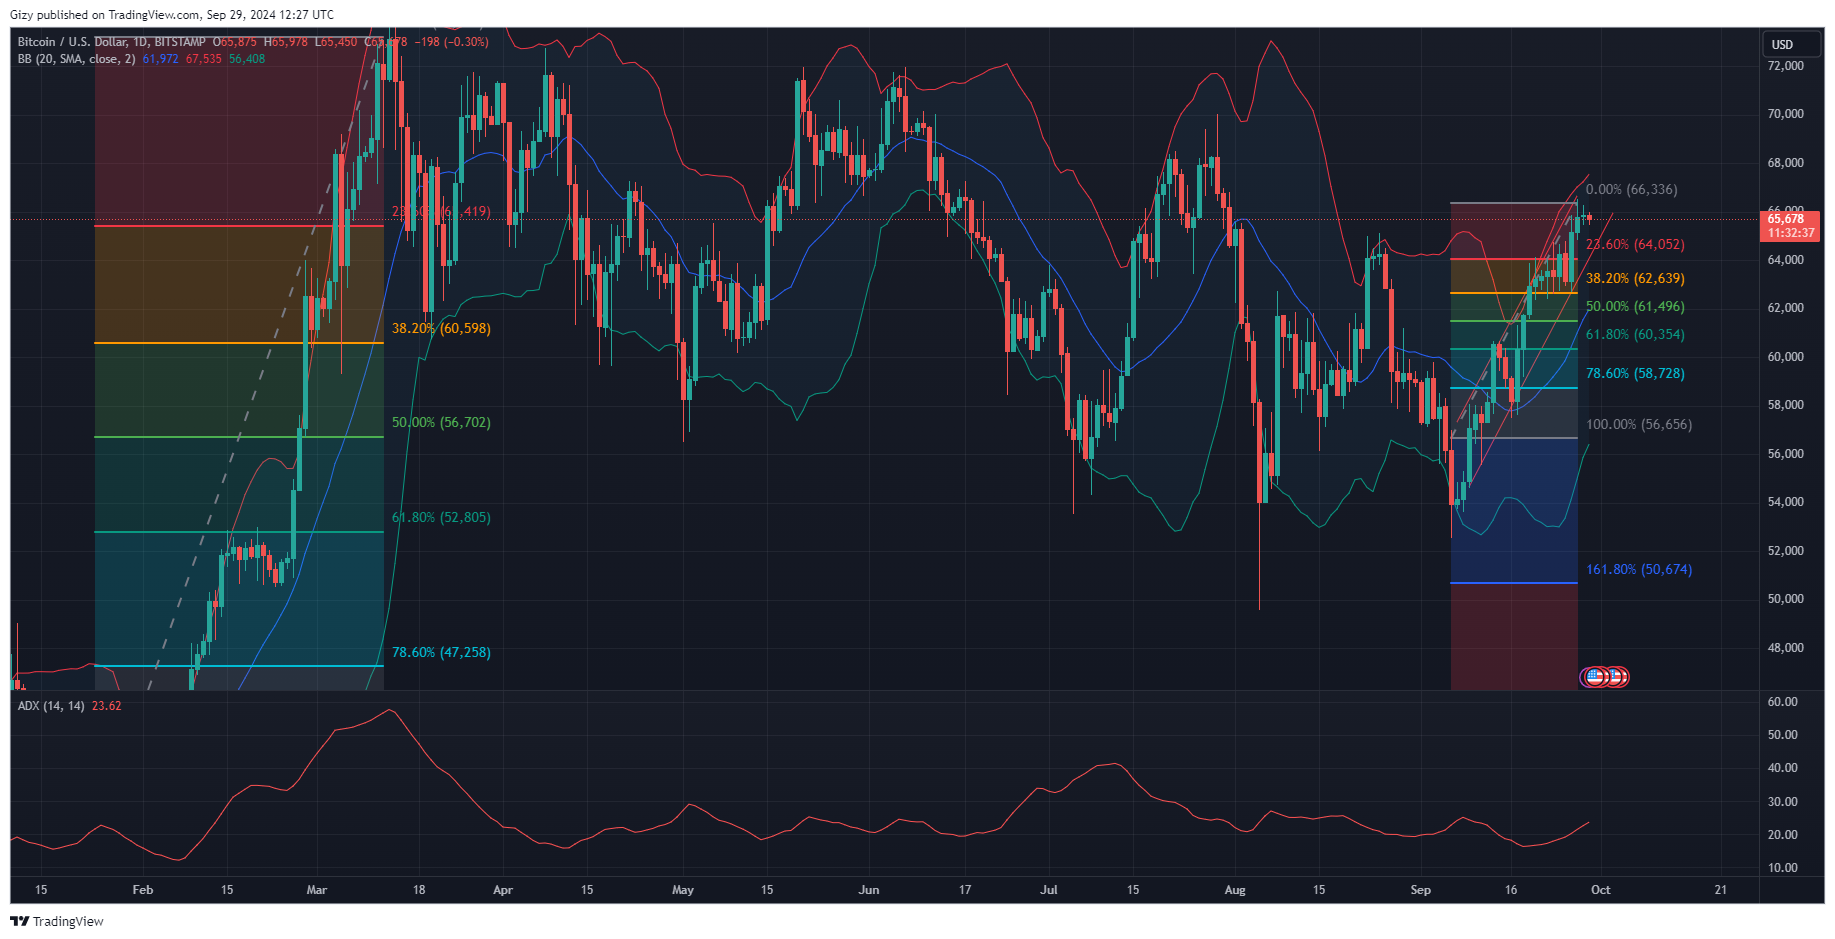
The uptrend continued into the next day when it broke the highlighted resistance. It tried continuing upwards but faced corrections at $66,400. The day ended with prices below $66k. It was also the last time the asset climbed above this critical mark, as trading action over the previous 48 hours suggests further decline.
Several indicators point to the gradual loss of the driving force behind the uptrend. One such is the relative strength index. The metric trended in a straight line during the previous intraday session. It is slightly lower at the time of writing as selling pressure mounts. The momentum indicator has halted its uptrend for the same reasons.
The current seven-day session marks the third week with consecutive gains. Prices have also been on the uptrend since the start. However, a bearish flag is present on the chart. Such a pattern indicates an impending decline but does not tell when it will start.
Indicators like the ADX and Bollinger bands hint at further increases. Due to this, the bands opened wider to accommodate further surges, and prices have yet to reach the upper SMA. The average direction index also suggests that it is not at its peak but may be closing in on it.
ETH/USD
Ethereum is currently in its second consecutive decline. The downhill movement comes after a two-day surge that saw it gain over 4%. The uptrend started on Thursday as it recovered from a drop below $2,600 the day before. It peaked at $2,667 and continued the uptrend the next day. It flipped the $2,700 resistance on Friday and hit a high of $2,740 as it festered hopes of reclaiming $2.800.
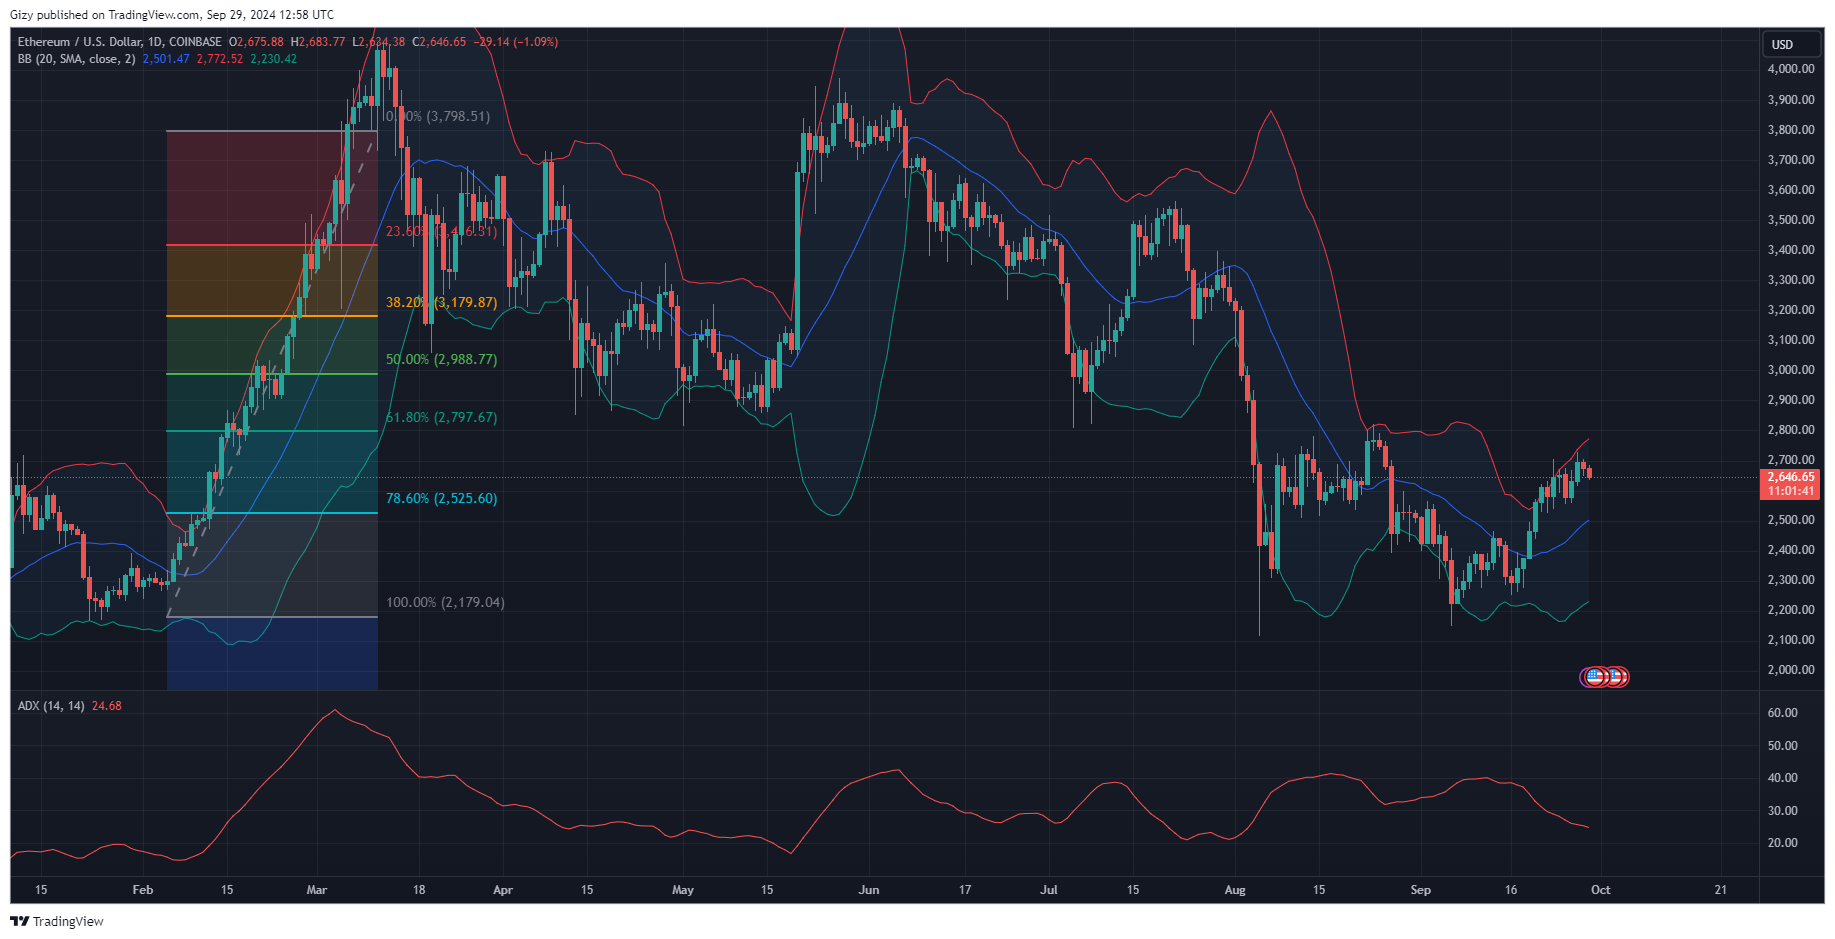
Trading action over the last 48 hours ended the green spree. Although not significant, the asset incurred small losses. The decline is ongoing, and it remains to be seen if it will stop before the day’s end. Nonetheless, some indicators are printing sell signals due to the latest price actions.
The accumulation and distribution chart has trended in a straight line over the last 48 hours. While it shows equal distribution and accumulation, it also means that buying volume is significantly low. This is the same reading on the RSI. The metric started declining during the previous intraday session, and the trend is ongoing.
ADX also points to the reducing strength of the uptrend. The metric is still declining and showing no signs of halting. The same pattern is present in the momentum indicator. It is struggling to resume uphill movement to no avail.
BNB/USD
Binance coin’s action on the weekly scale shows very little price improvement. It is barely up by 2% as the bears stage several selling congestions, almost entirely erasing the gains it had.
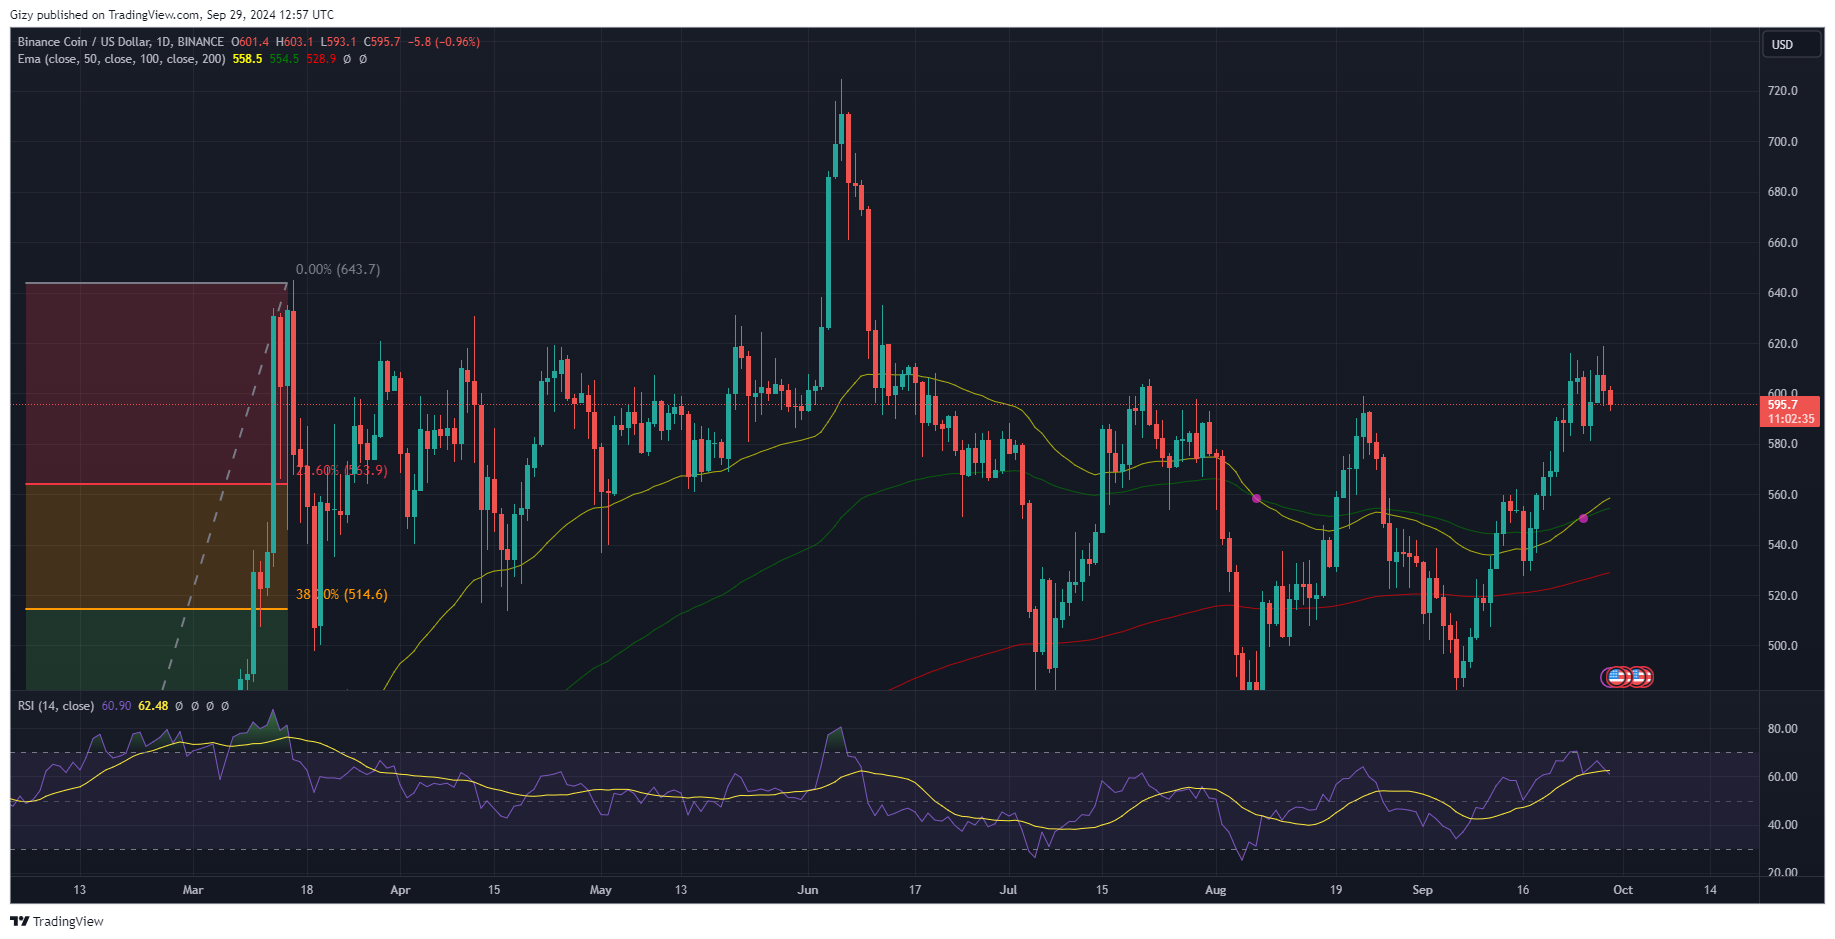
One of the most significant losses happened on Wednesday. It opened trading at $606 but had small increases. However, the bear started a sell-off that saw prices retrace below $590. The decline halted at $584, and the day ended at $587, with losses exceeding 3%.
Trading action over the next two days shows significant bullish activities. The coin reclaimed $600 after it dropped to $595. It attempted the $620 but failed to break above it. However, it closed with small losses and is continuing the trend.
While news of the former Binance CEO’s release spread positivity across the market, it failed to have a lasting impression on BNB, as many expected. Although the altcoin has been exchanging within the Bollinger band, RSI has been declining in reaction to trading actions over the last 48 hours. Nonetheless, the A/D is slight as the bulls attempt a buyback.
ADX continues its parallel movement as there is no notable push from both factions of the market. This has also translated to the momentum indicator, which is declining.
XRP/USD
Ripple’s native coin is having its last-minute surge. It started the day at $0.61 but experienced a massive increase in buying pressure. It surged and briefly broke the first pivot resistance at $0.66. It retraced following the flip as the bulls failed to sustain the run. Nonetheless, it is up by over 5%.
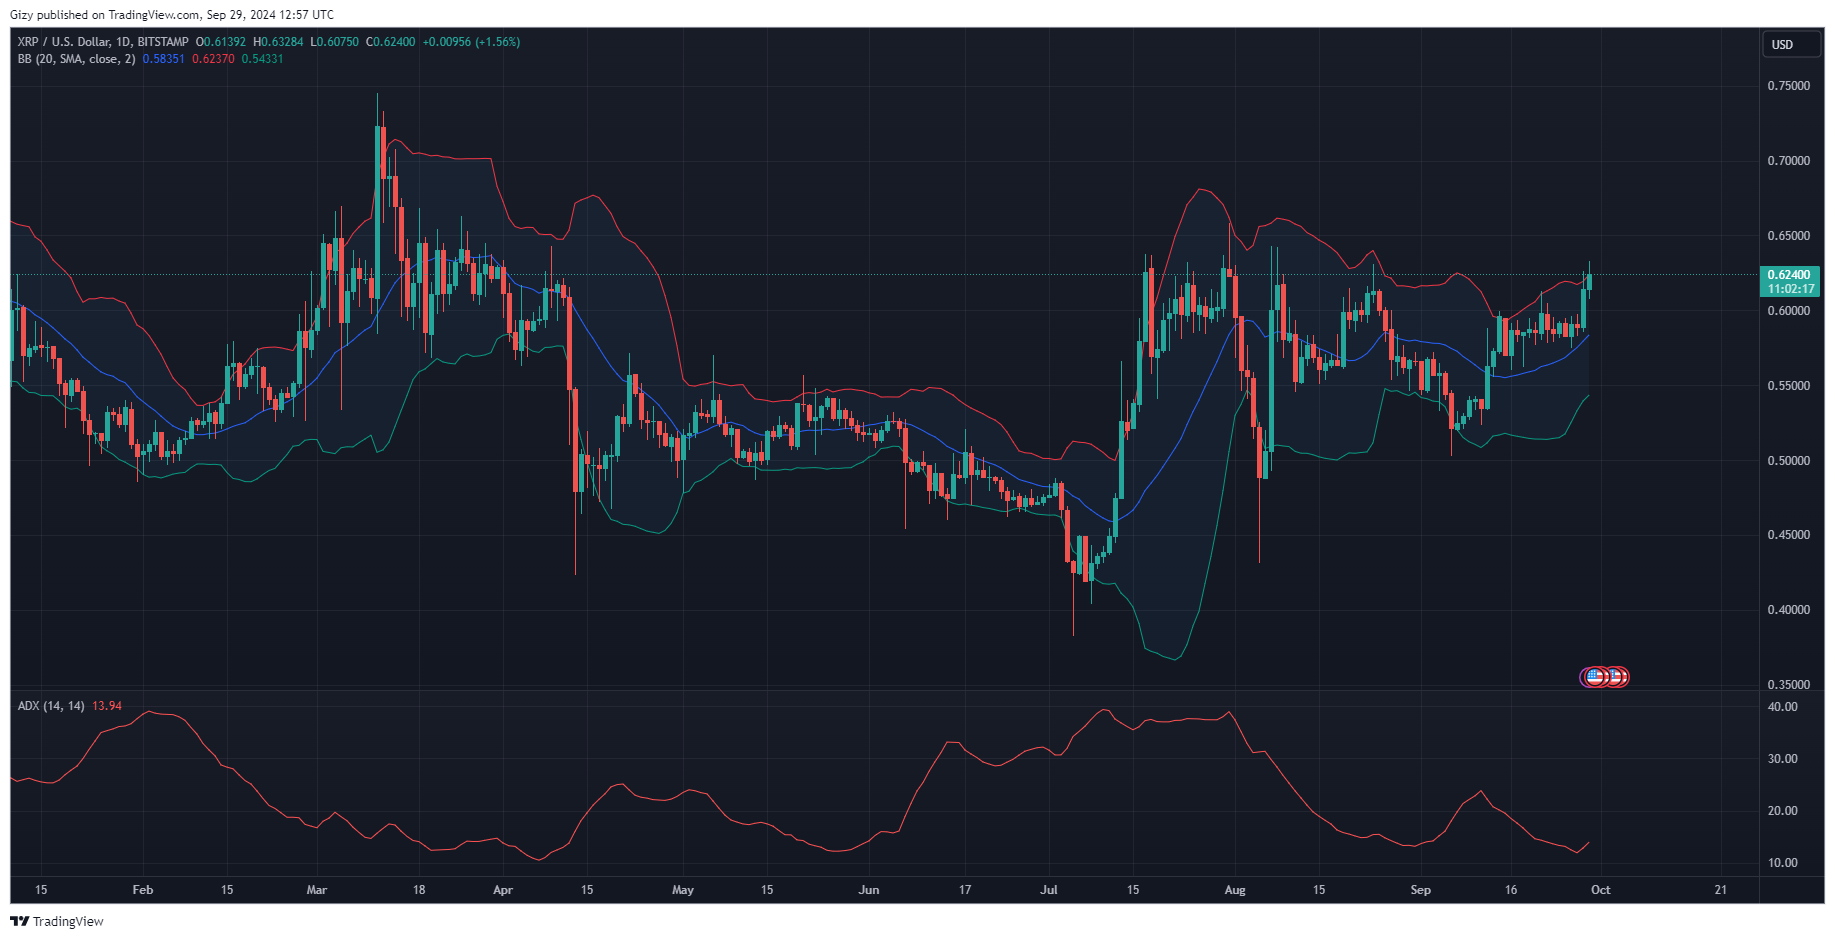
The current day action is not an isolated incident, as the coin registered notable increases during the previous intraday session. The day started at $0.58 and surged to a high of $0.62. The buyers failed to sustain the pressure and price retarced afterward. It also registered gains exceeding 4%.
The latest XRP surge comes after it traded within the $0.58 and $0.60 channel for most of the week. Its breakout shows several bullish indicators. Nonetheless, the asset may close the seven-day session with gains exceeding 10%.
The average direction index is on the uptrend due to the latest surge. It also points to a possible continuation as momentum continues growing. However, the relative strength index is at 69, indicating that the altcoin may become overbought if the surge continues. Additionally, its above the upper SMA of the Bollinger band.
