ETH is closing the week with small gains. The last seven days saw the asset exude notable volatility but not enough to see the asset reclaim all lost levels.
The global cryptocurrency market cap is almost stagnant as it saw less volatility due to the inability of major assets to surge.
Price uncertainty continues to play a major role in market sentiment. More traders are still bearish, as speculation about most assets are negative. The Asian market is also negative as funding rates from this region dropped.
Nonetheless, news of several exchanges reentering certain regions may add volume to the global cryptocurrency trade.
Amidst the lack of definitive fundamentals, let’s see how some assets in the top 10 performed in the last seven days.
BTC/USD
Bitcoin funding rates on Binance, the world’s largest cryptocurrency exchange by trading volume, have hit their lowest point this year, signaling a significant shift in market sentiment.
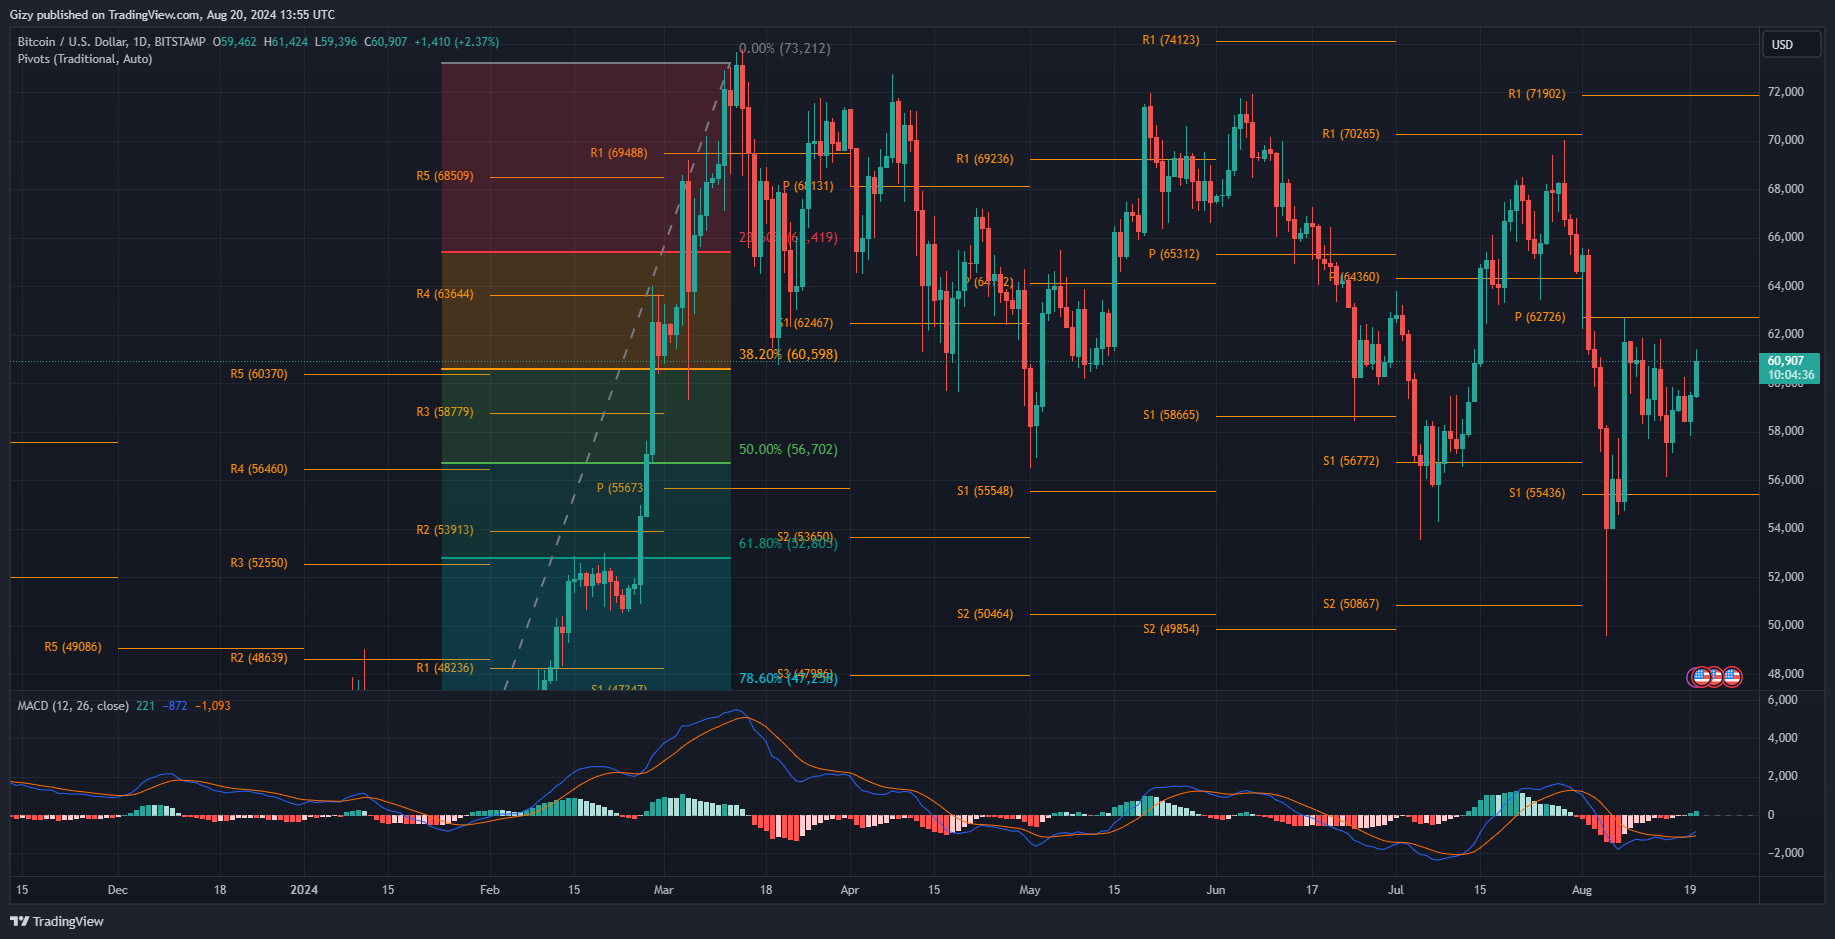
While this explains the ongoing struggle, it may also indicate an impending downtrend. It is also the reason behind several Wednesday dump that saw the asset drop after it failed to decisively flip $60k. It retraced to $58k and closed with losses of over 3%.
BTC has since recovered as it seeing small hikes. For example, it saw its biggest surge of the week on Friday as it attempted $60k but hit a brick wall at $59,841. Nonetheless, t closed with gains exceeding 2%.
Current prices show that the bulls are building momentum as the asset edges closer to its pivot point. Indicators like the accumulation and distribution chart also agree with this assertion, showing a gradual rise in buying volume.
The moving average convergence divergence has resumed printing buy signal. The 12-day EMA intercepted the 26-day EMA. With the ongoing bullish divergence, the bulls will look to sustain the ongoing accumulation.
The buyers must decisively flip $60k to keep prices above the 200-day exponential moving average. With current struggles raging, it is worth noting that on-chain metrics are bullish. Corporations have resumed buying ETFs. It remains to be seen how this will affect price performance in the coming days.
ETH/USD
Ethereum reported a drop in gas fees, with some reports claiming they dropped to their lowest in the last three years. Amidst the drop in Gwei, an unidentified Ethereum user made a costly mistake during an on-chain transfer on August 11. The wallet paid 34.26 ETH (approximately $89,239) in gas fees to transfer just 0.87 ETH (worth $2,262).
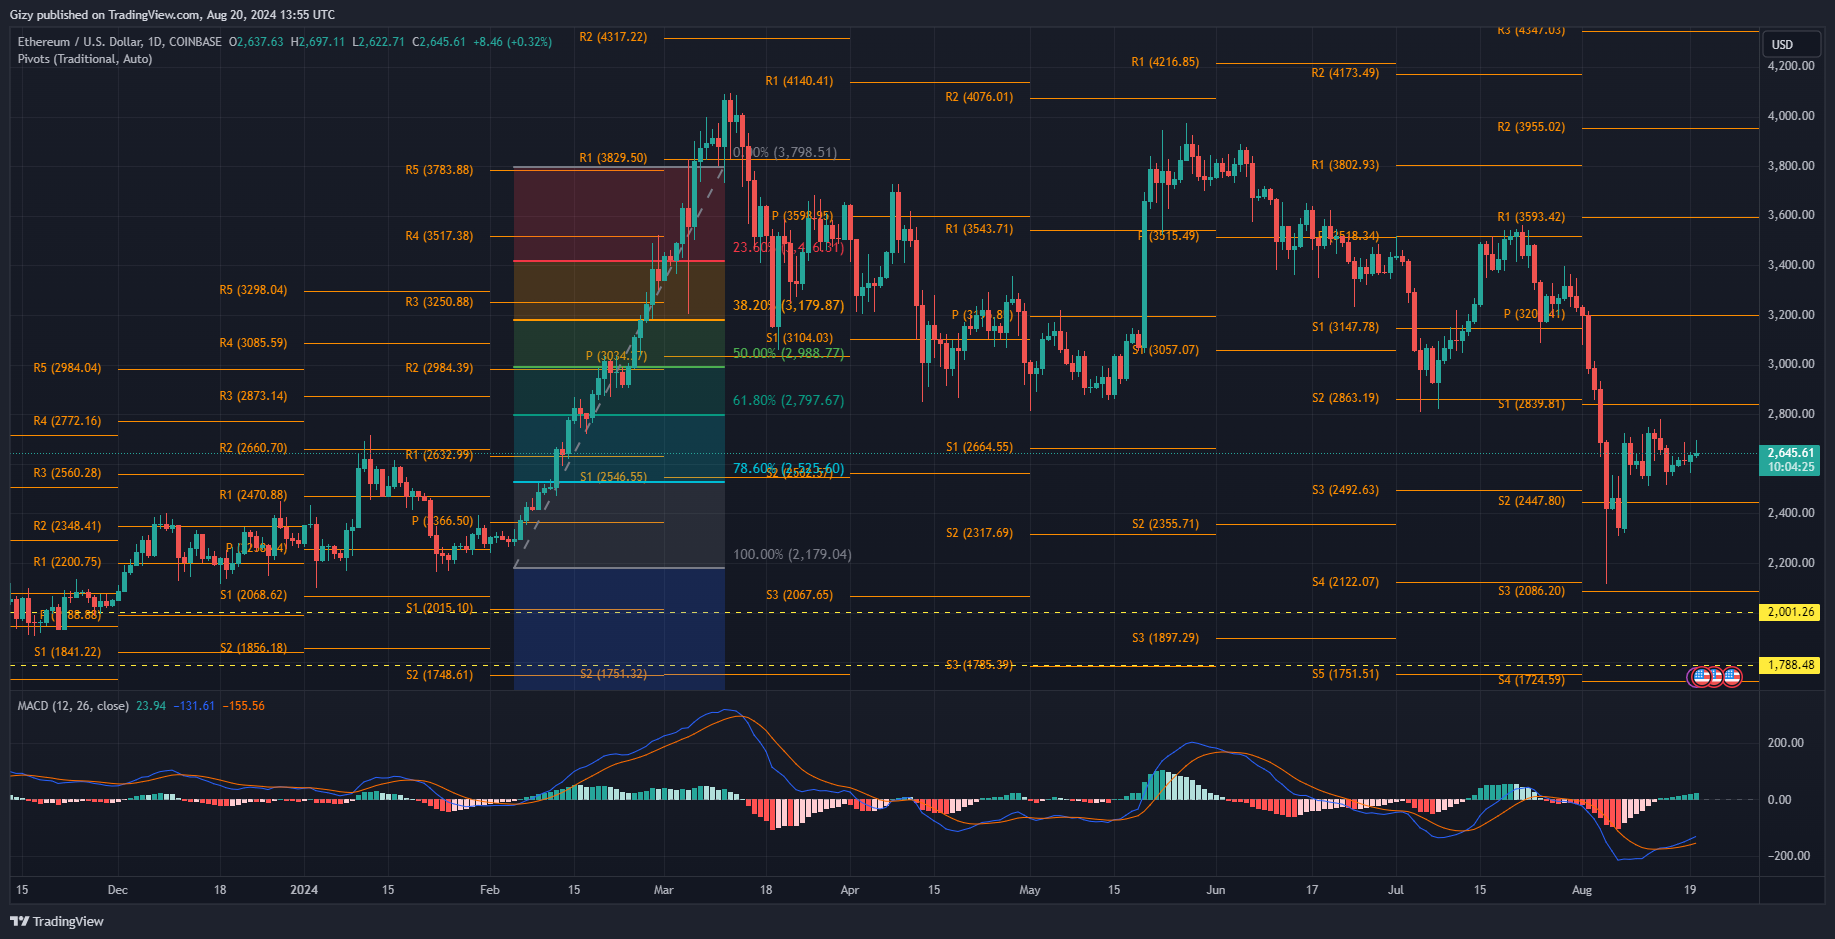
Nonetheless, the drop in gas fees is due to a decline in transactions in the ecosystem. With less congestion, the computing power needed to solve problems is reduced.
The coin is seeing a gradual increase in buying volume as suggested by the last two days’ actions. It had green candles during this period and is printing another at the time of writing. The A/D chart is also on the rise in reaction to the unfolding trend.
Ethereum’s latest price push may also be due to more buys in ETFs. However, it remains to be seen if these will be enough to hold the current price and attempt further resistance.
It is worth noting that the 0n-chain RSI is neutral, which is in sharp contrast to the reading from the one-day chart, which shows the metric on the rise.
BNB/USD
Binance coin is seeing notable increases at the time of writing. It is making moves at further resistance as it is seeing further increases.
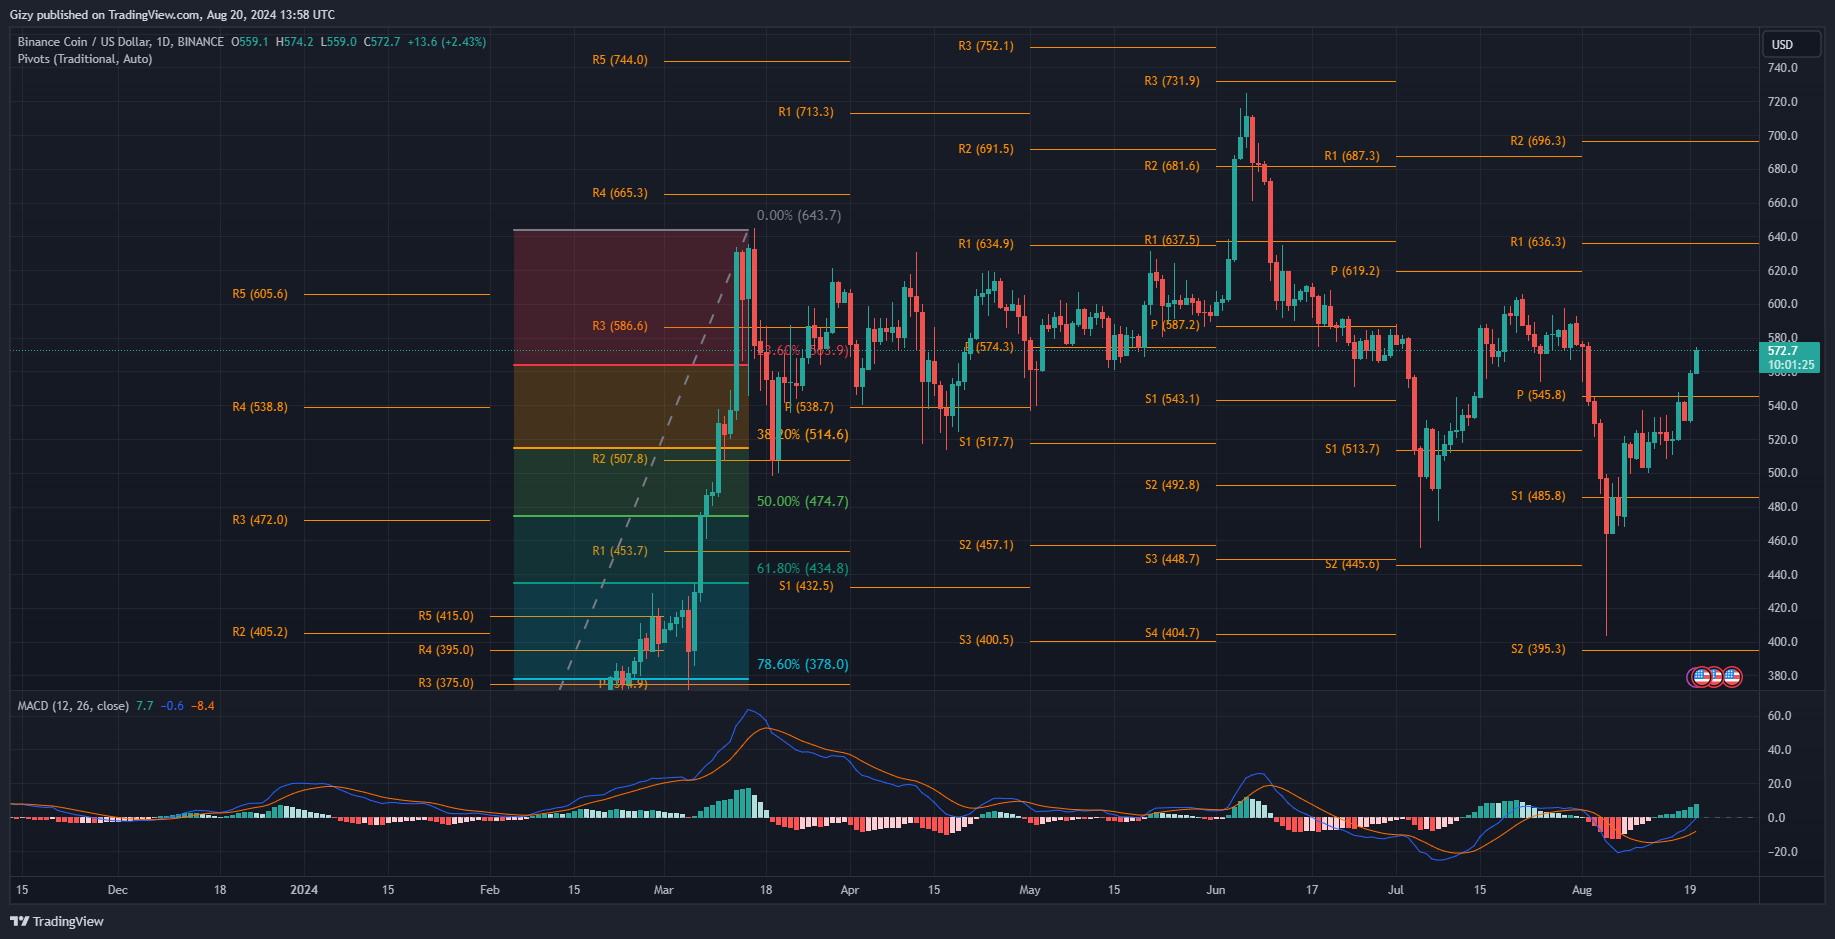
The asset is seeing a significant shift in price trajectory and is attempting recovery with limited success. The last seven days saw Binance coin retest $550 but retrace at $547. The event took place on Saturday, as it opened trading at $530 but briefly flipped its pivot point.
It failed to continue the trend on Sunday, resulting in losses of almost 2%. The uptrend is back in play, as the asset is up by over 4% in the last 24 hours. Trading volume significantly improved, and prices followed.
BNB saw a significant increase in buying volume as more bulls started accumulating. The positivities in the crypto market may be the catalyst for the latest surge. Nonetheless, the news of the exchange entering India and reaching new clients may also be another reason for the push.
The cryptocurrency is trading above its pivot point. The bulls must sustain the most recent trend, as the PP may serve as critical support in the coming days.
MACD’s had a bullish divergence over the last seven days amidst the little volatility the altcoin registered.
SOL/USD
Solana was bullish last week. It gained over 3% on the first day, opening trading at $141. It peaked at $151 but retraced to $146.
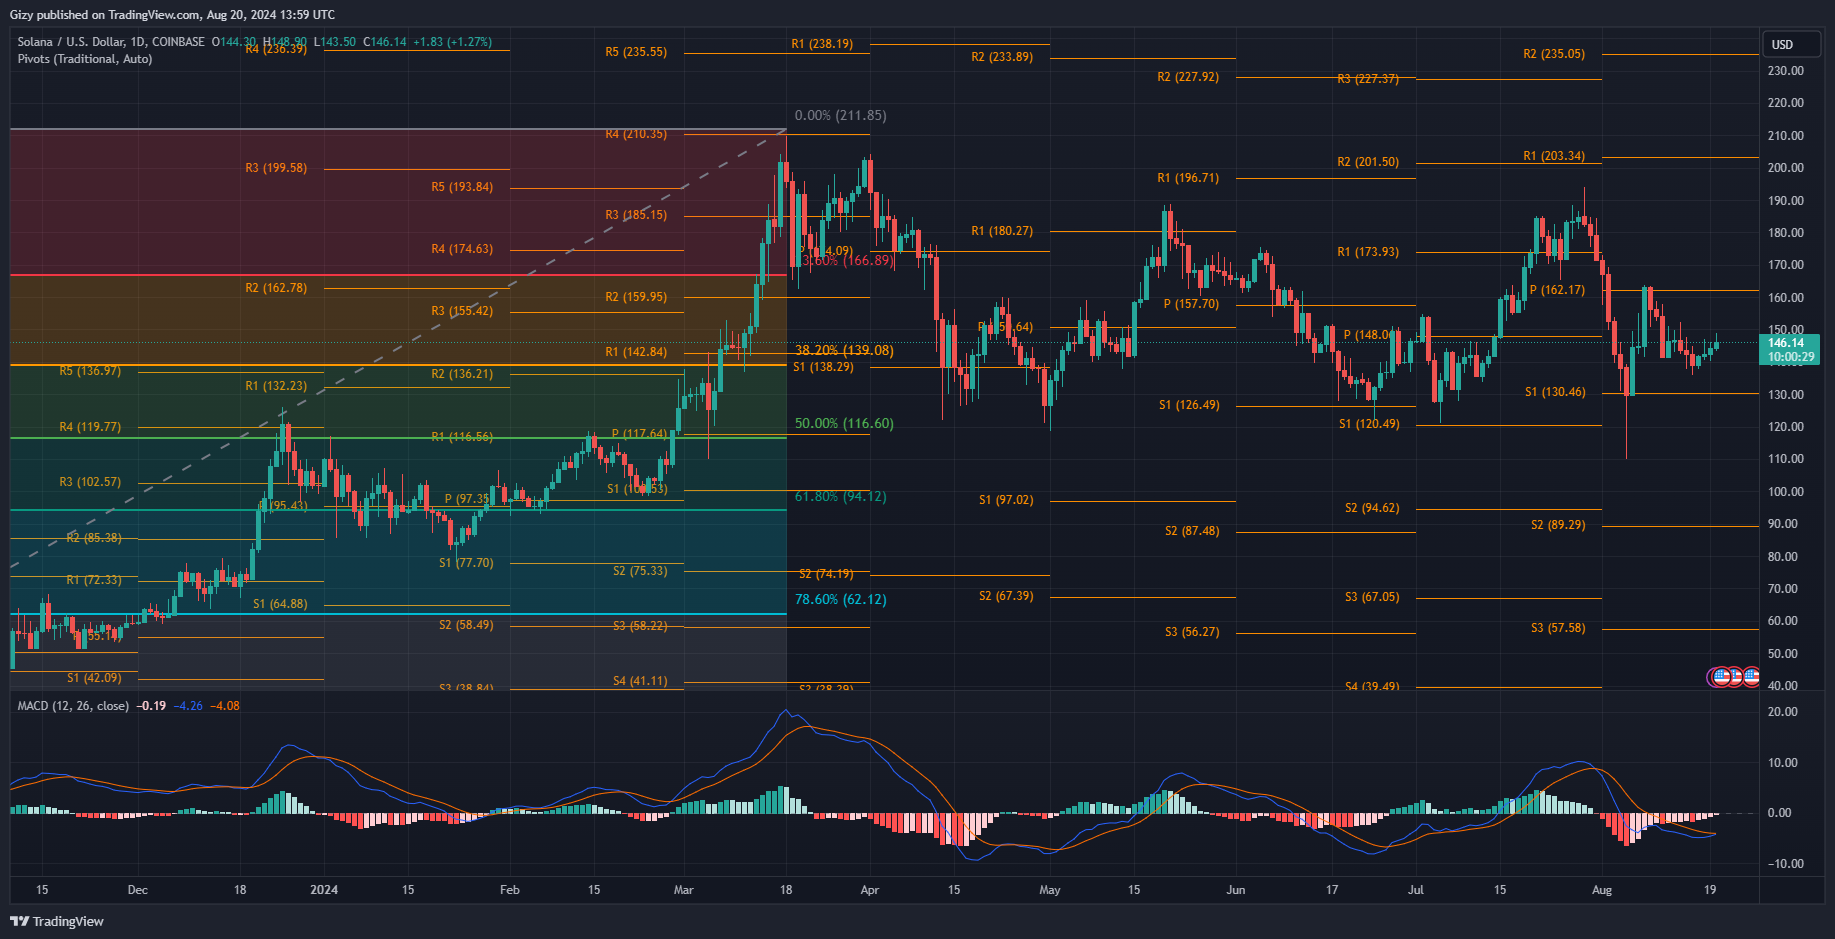
It retested $150 on Wednesday afte starting the day at $146. It briefly flipped the highlighted mark and hit a high of $152. However, it retraced and closed at $143, with losses exceeding 2%. The decline continued over the next two days and SOL hit a low of $136.
The cryptocurrency has since attempted recovery to no avail. The asset failed to register any notable price improvements on the weekly scale as it ended the session with a doji.
Solana is yet to see any definite upward push. It is printing a doji amidst several bullish fundamentals. One such is an increase in revenue generation. The ecosystem continues to generate profit amidst the gradual memecoin launch.
The decline is due to the platform and pumpdotfun banning its most active launcher, the Indians. Banning users from this region has since resulted in less activity on the gain.
MACD is printing buy signals despite the almost stagnant price. The 12-day EMA is gradually closing in on the 26-day EMA. If trading conditions remain the same, an interception may happen in the next 24 hours.
XRP/USD
XRP is printing one of its largest daily candles. It started trading at $0.56 but surged and briefly flipped $0.60 and peaked at $0.61. However, it retraced and is trading below the highlighted resistance. Nonetheless, it is up by over 6%.
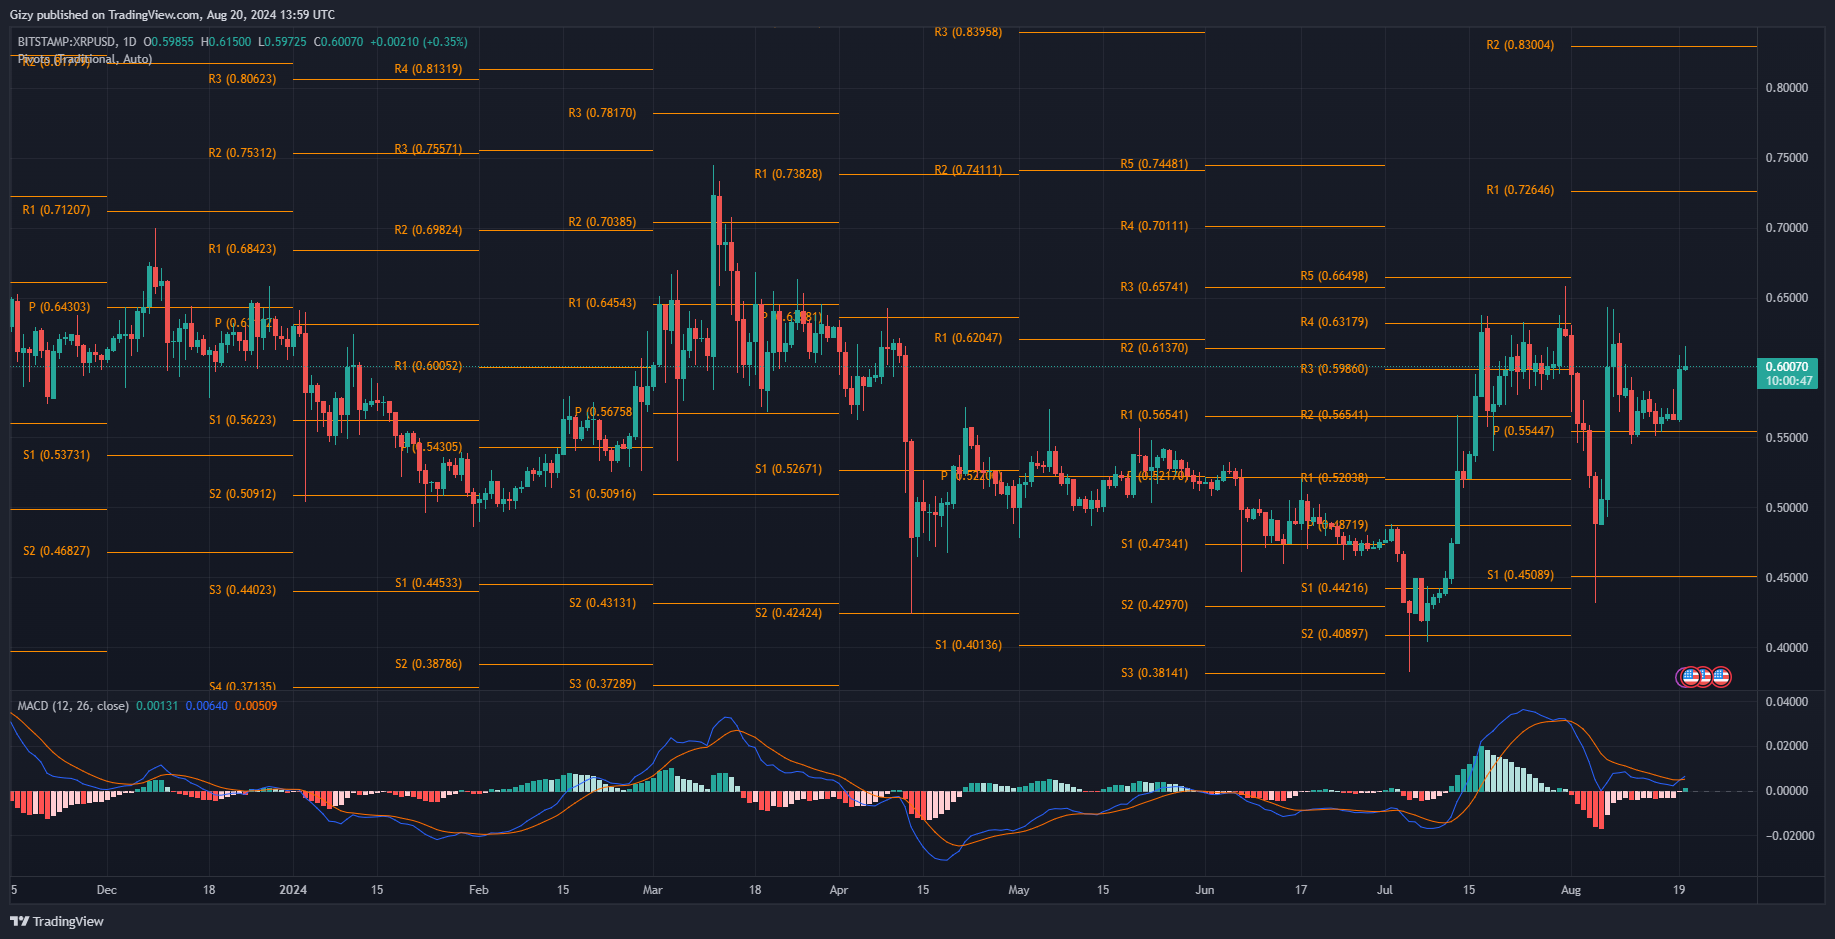
The moving average convergence divergence has since reacted to the latest price change. The 12-day EMA is close to its counterpart, and the bulls must sustain the current trend to guarantee the divergence.
