BNB returned to $600 during the previous intraday session. It joined the rest of the crypto as it enjoyed a notable bullish push.
Other assets in the top 20 also registered notable increases during this period as they soared. SUI was the top gainer, opening the day at $1.77 and surging to a high of $2.1. Although it had minor corrections, it closed with gains exceeding 15%.
Shiba Inu woke from its previous week’s slumber and gained over 4%. It started the day at $0.0000182 but surged after a brief decline to $0.000017. It rebounded and peaked at $0.0000198 as its bid at $0.000020 came to an abrupt end. Nonetheless, it broke above its 30-day high.
The crypto market saw a massive 205% increase in trading volume as the bulls went on a buying frenzy. Valuations also peaked above $2.45 trillion, signifying a 5% change.
The market seems calm following the previous day’s surges. The fear and greed index is at 67 and has yet to surge, as the bulls may be exhausted. Let’s see how some assets in the top 10 performed and what indicators show.
BNB/USD
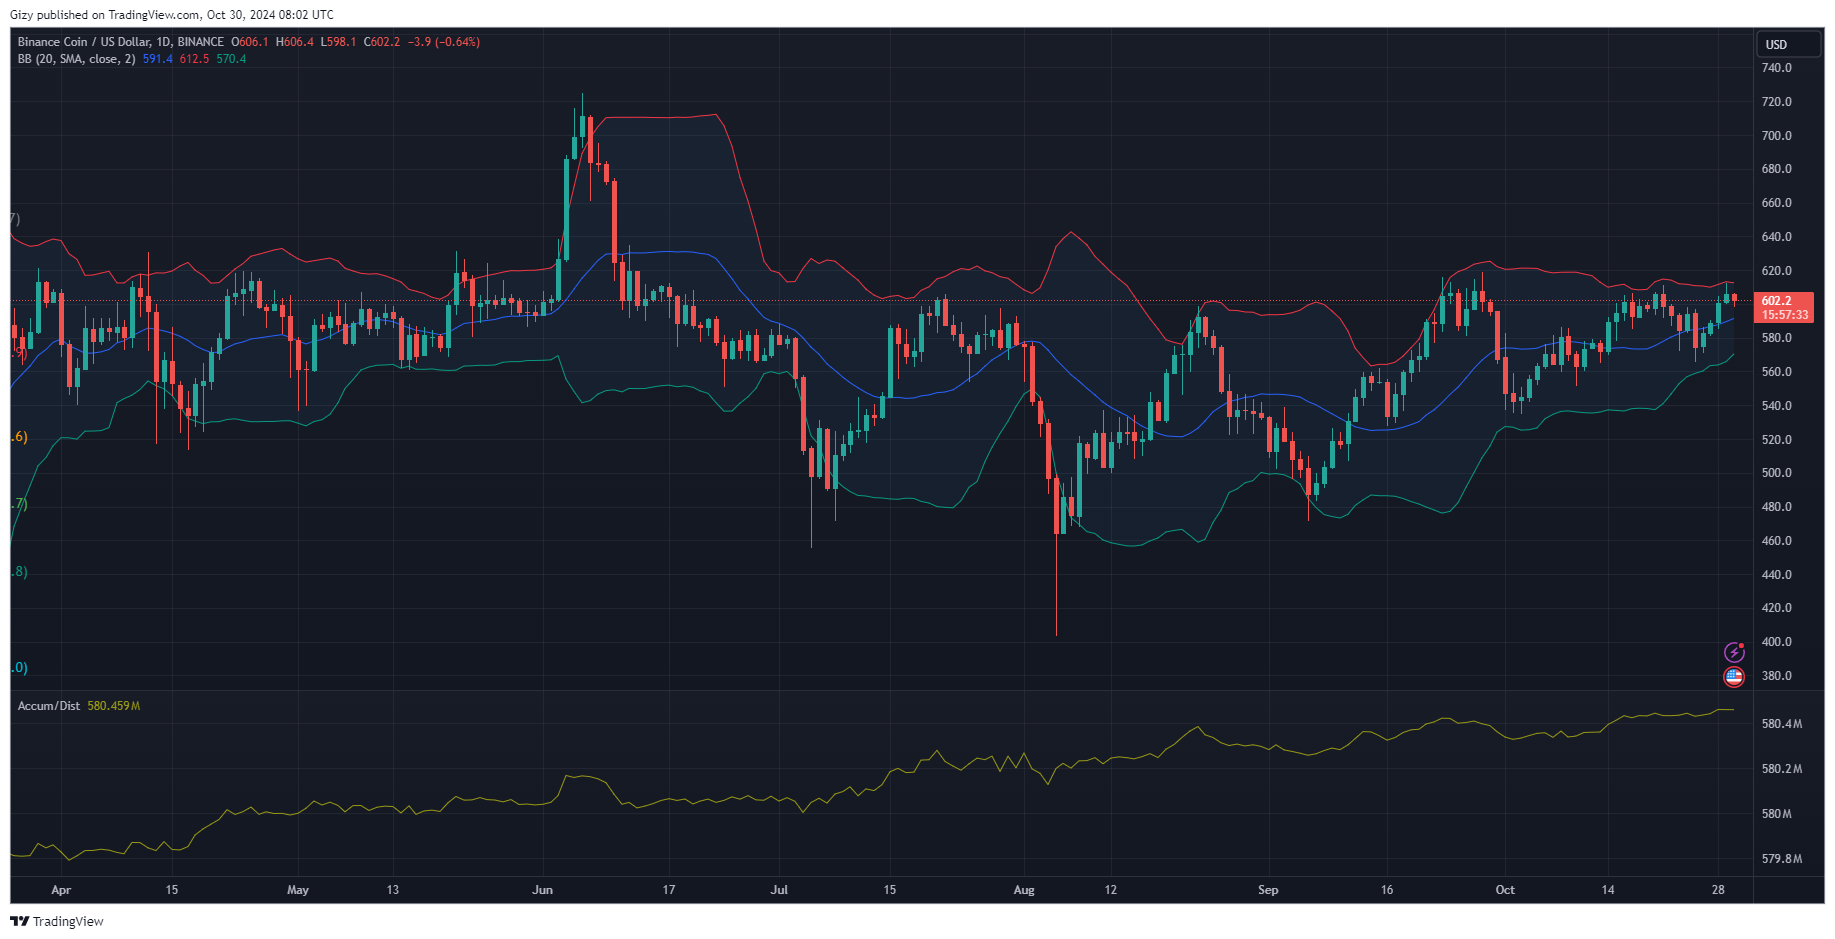
Binance coin has been on the uptrend over the last four days, reclaiming its lost level and erasing the losses it incurred last week. It was off to a good start on Monday. It opened trading at $589 and surged after a brief decline. It broke above $600 and peaked at $604 but closed with gains exceeding 2%.

The uptrend slowed during the previous intraday session as the asset registered small increases. It peaked at $612 but failed to sustain the momentum, closing at $606 with no notable change in price. Trading actions during this session show that bulls are getting exhausted.
BNB is printing a red candle at the time of writing. It struggles to keep the price above $600 after slipping slightly below it a few minutes ago. It remains to be seen if the buyers will rally the market. Nonetheless, indicators are reacting to the ongoing trend.
The moving average convergence divergence prints buy signals amidst the slight decline. The 12-EMA intercepted the 26-EMA during the previous intraday session, and a bullish divergence is underway. The relative strength index also shows notable attempts by the bulls to maintain the uptrend. It slightly increased during the previous intraday session.
However, the Bollinger bands shed light on why BNB is struggling. It shot up to the upper band yesterday, indicating the uptrend may end soon. The accumulation and distribution chart shows an equilibrium in supply and demand.
SOL/USD
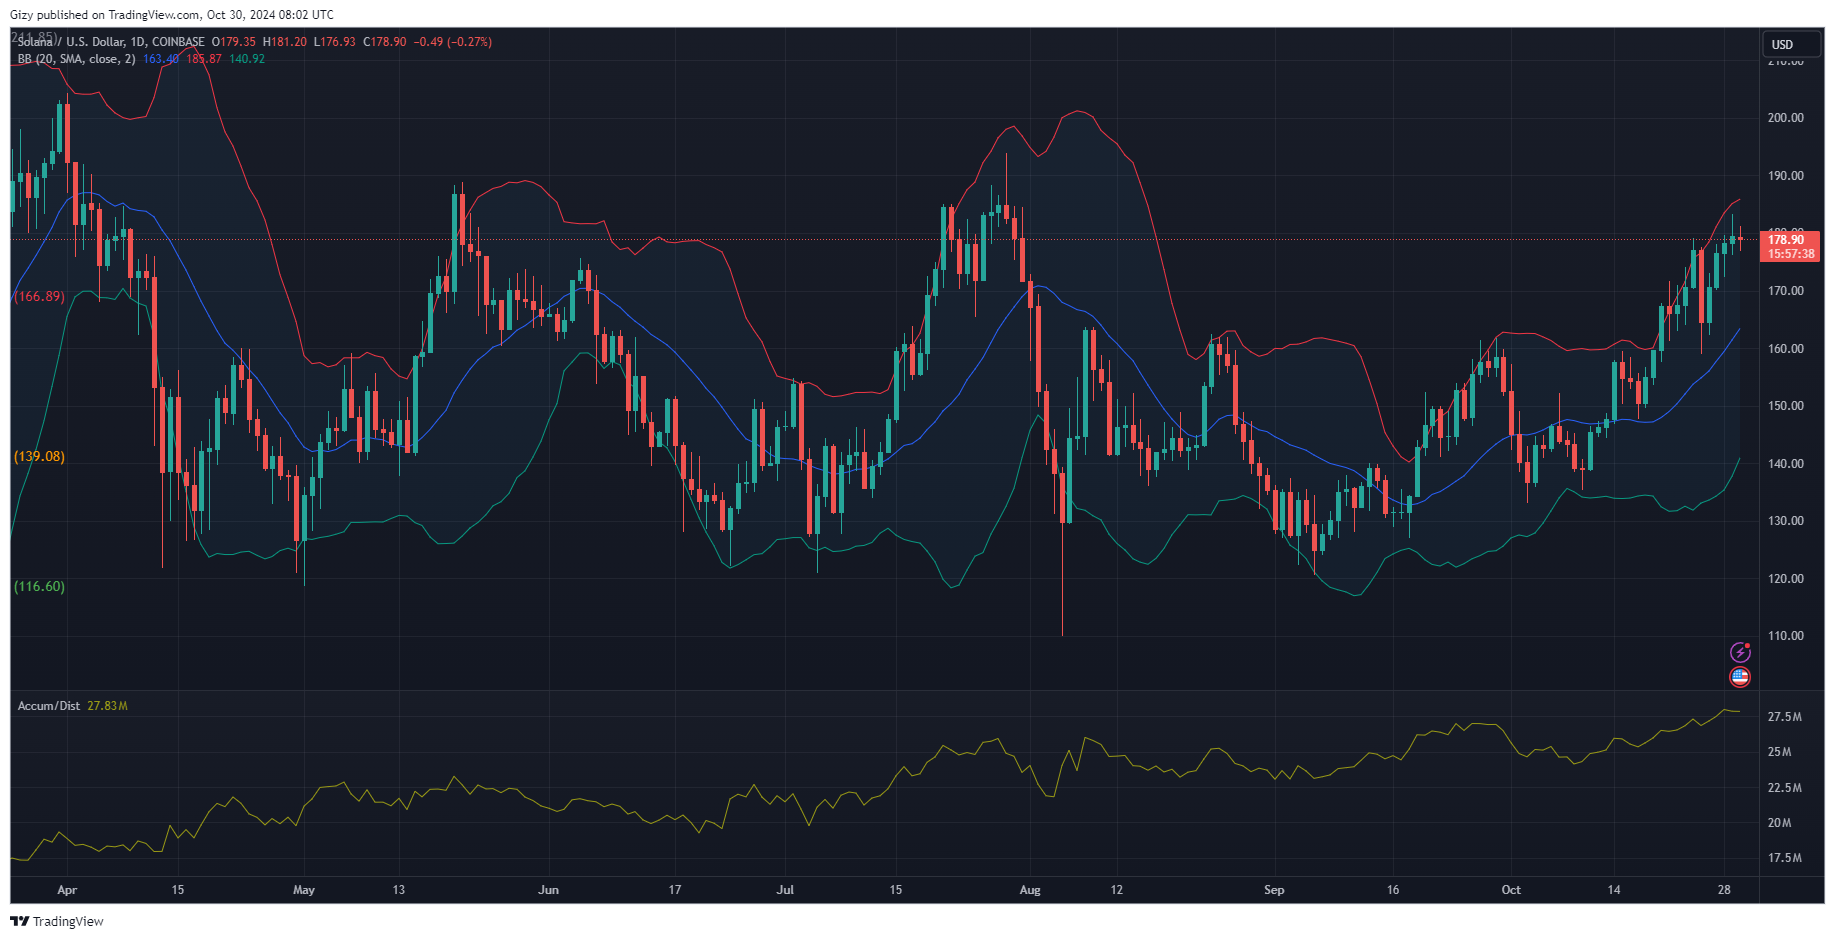
Solana struggles to keep prices above $178, slipping to $176 a few hours ago. Currently printing a doji, the candle hints at less volatility in the coming hours. This is what the A/D chart hints at: the bears are edging as the bulls fail to soak up the growing supply. Due to this trend, the metric is declining at the time of writing.

The relative strength index mirrors this movement as the asset grapples with a slight increase in selling pressure. Nonetheless, this is not the first time SOL has had a bearish start to the day; it remains to be seen if trading conditions will improve in the coming hours.
Nonetheless, the Bollinger band suggests that the uptrend may end. A closer look at the metric shows that the altcoin moved closer to the upper band, which many consider a bearish movement that might spell the end of the uphill movement.
The latest increase is unsurprising, as Solana has been on the uptrend over the last four days. One of the highlights of the session happened on Saturday as the bulls rallied the market following the 7% loss the previous day. It surged from $164 and peaked at $170, closing with gains of almost 4%.
XRP/USD
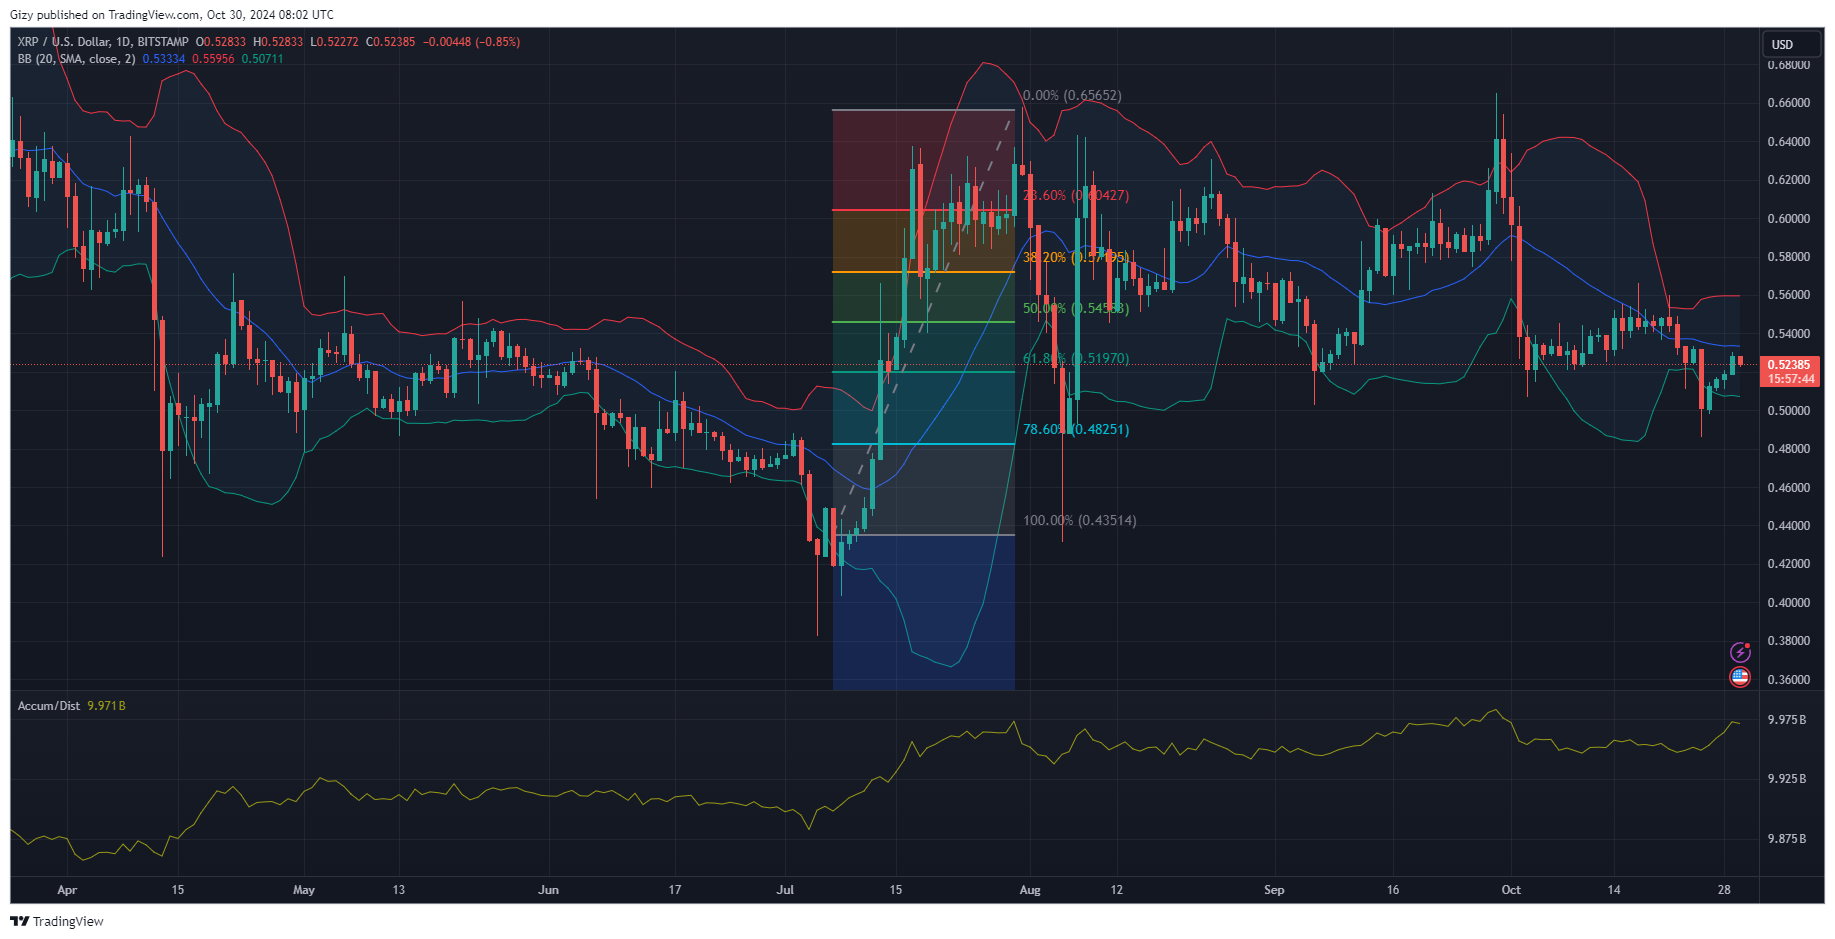
XRP is printing its first red candle after four days of consistent price increases. It is slightly down but struggles to stay above $0.52. The accumulation and distribution channel shows that some traders are dumping their bags following the previous day’s increase. The metric is declining as the bulls fail to soak up the supply, resulting in the ongoing price decline.

The asset is trading above a critical level: the first pivot support, a level with notable demand concentration. MACD hints at a possible improvement in trading conditions. The 12-day EMA completed the bullish convergence a few hours ago, and a divergence could be underway if the bulls rally the market.
The Bollinger band shows room for more price increases as the asset continues exchanging between the lower and middle SMAs. The latest readings come after the asset returned between the marks a few hours after it broke below them.
The recovery started on Saturday when the altcoin opened trading at $0.50 and had a massive increase in buying pressure that resulted in price shooting up. Although it failed to reclaim $0.52, it ended the day with a gain exceeding 2%. It continued the uptrend over the next three day and gained over 4%.
DOGE/USD
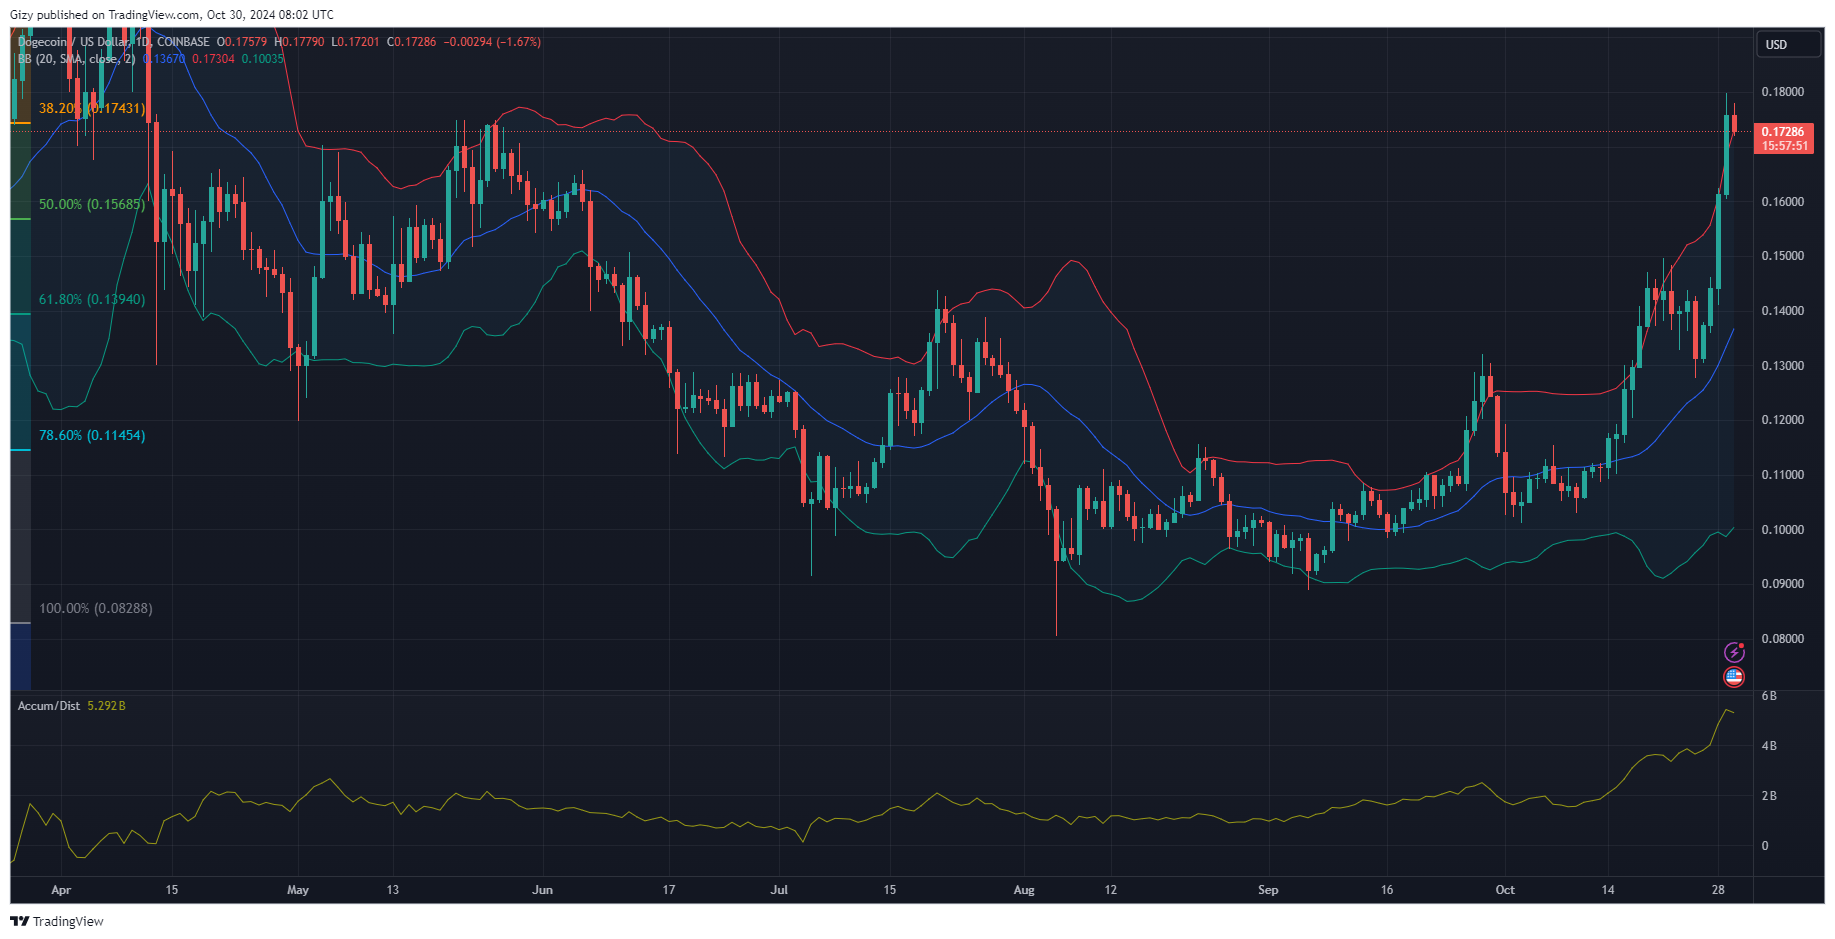
Due to massive rejections, Dogecoin failed to flip $0.18 during the previous intraday session. It halted its advance at the threshold of this key level but closed with huge increases. The day started with prices at $0.16. A huge increase in buying pressure shot prices to a high of $0.179. It gained almost 9%.

The latest surge is not isolated, as it registered a similar increase during the previous intraday session. It surged from $0.14 and broke the $0.16, closing with gains of almost 12%. The latest increase resulted from massive positive fundamentals the asset saw.
Nonetheless, it is struggling to continue the uptrend. Currently trading at $0.172, it may slip below the $0.17 barrier. The A/D chart shows that traders are taking profit at the time of writing, resulting in this metric declining.
The Bollinger hinted at a further decline as the asset surged above the upper band during the previous intraday session and continued the trend in the last intraday session. Down by 2%, it is yet to return to the ‘normal level.’
Dogecoin was overbought during the previous intraday session as the relative strength index continued above 70, hitting 80. The downtrend may continue until it drops below 70.
