XRP has grappled with massive declines since it started and is yet to recover. The downtrend is ongoing as other assets in the top 100 are yet to register notable increases.
Bitcoin sees a cooldown after it attempted $69k on Oct. 24. It is struggling to keep its price above $67k at the time of writing following another failed attempt a few hours ago.
Ethereum is facing a similar situation. It recently tried reclaiming $2,600 but faced massive rejections at $2,564. Currently trading at $2,534, it is down by almost 2%.
The crypto market is taking a hit. Trading volume dropped by almost 3%, and capitalization is slightly down. A closer look at the top 100s shows a minimal uptrend across several cryptocurrencies.
Fundamentals are relatively silent, as none can trigger a price rally. Nonetheless, Microsoft’s shareholders are pushing the firm to adopt a Bitcoin reserve in 2025. Other company executives are appealing to concerned parties to vote against the move.
Let’s see how some assets in the top 10 performed over the last five days
XRP/USD
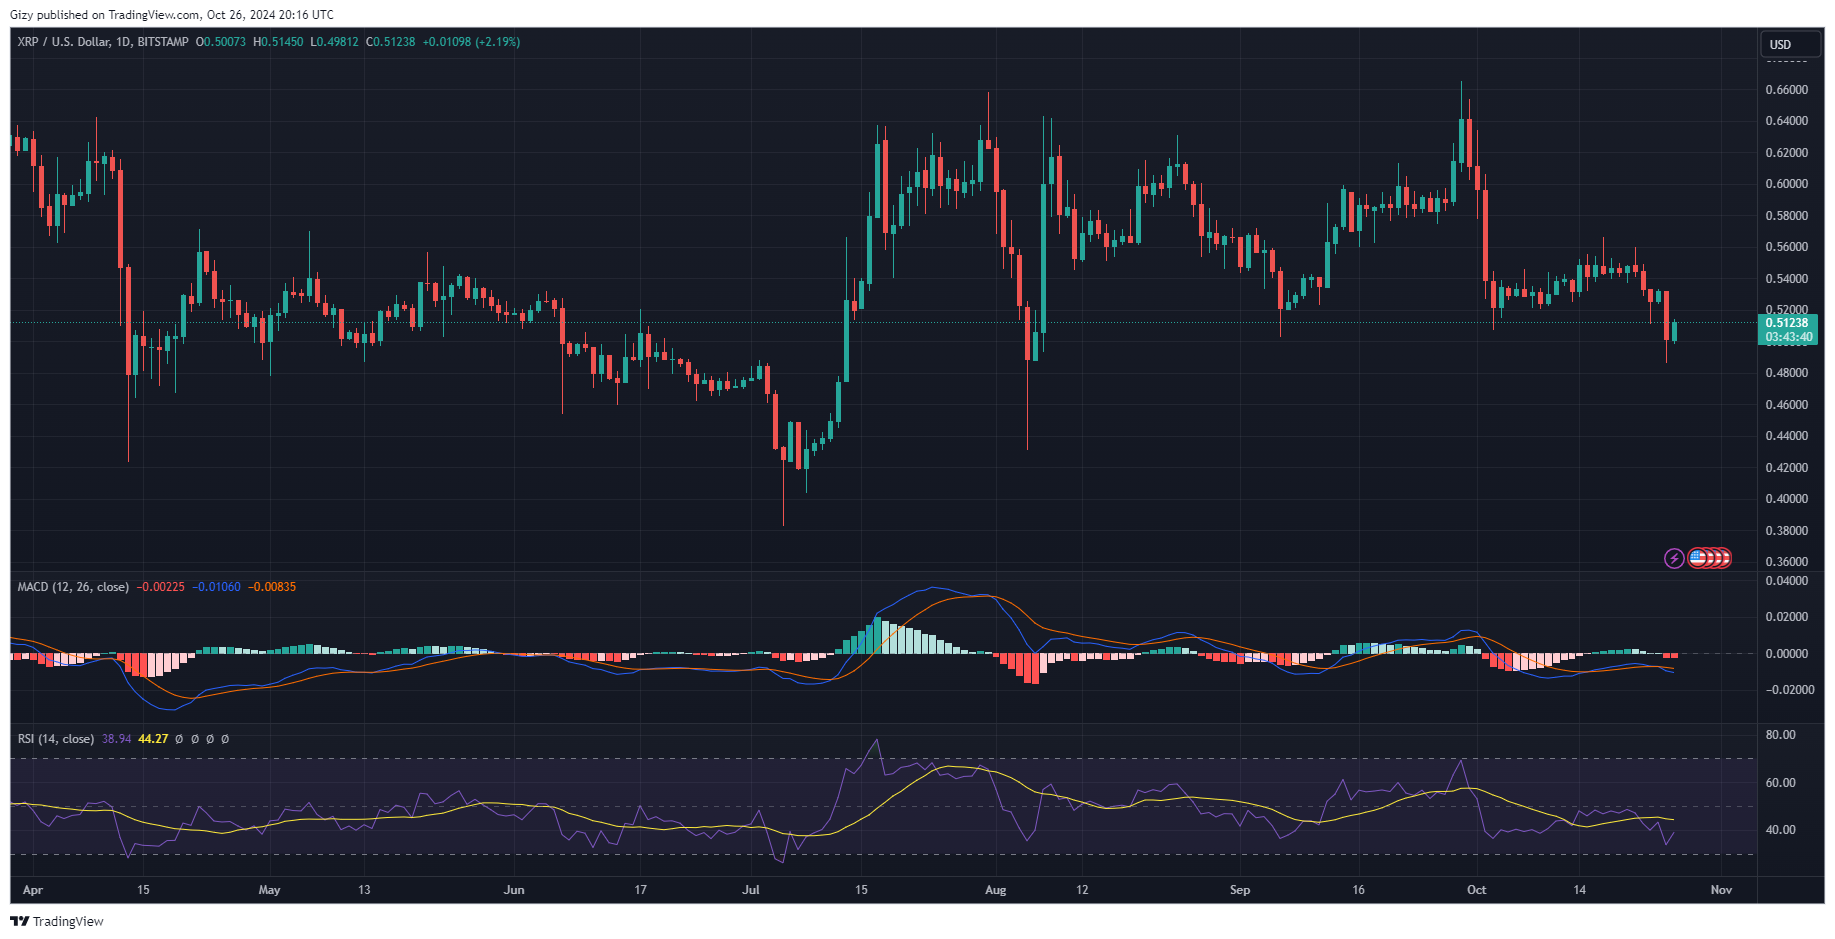
XRP is currently down by over 7% on the weekly scale as the bulls failed to continue the previous week’s price climb. The candle representing price action during this period has wicks sticking from both ends, indicating a high and low.

The altcoin attained its highest valuation of the week on Monday, opening the day at $0.54 and experiencing a small spike in buying volume. It peaked at $0.56 but retraced and closed below its opening price.
The downtrend picked up the next day as it slipped further, hitting a low of $0.52 and closing with losses exceeding 2%. It sank lower on Wednesday, breaking the previous day’s support but rebounding off $0.51 and closing with slight losses.
XRP dropped to its lowest during the previous intraday session. It started at $0.53 and an instant spike in selling volume, resulting in a massive decline. The altcoin dropped to a low of $0.48 before finding support. Although it had a slight recovery, the day ended with losses of almost 6%.
Currently printing a green candle, indicators are still bearish. The moving average convergence divergence is yet to resume printing buy signals as the 12-day EMA continues its decline. The metric showed a negative divergence a few days ago, and the shorter timeframe of the exponential moving average has since continued downward.
XRP also broke out of the Bollinger bands during the previous intraday session. It dropped below the lower band and is exchanging below it at the time of writing.
DOGE/USD
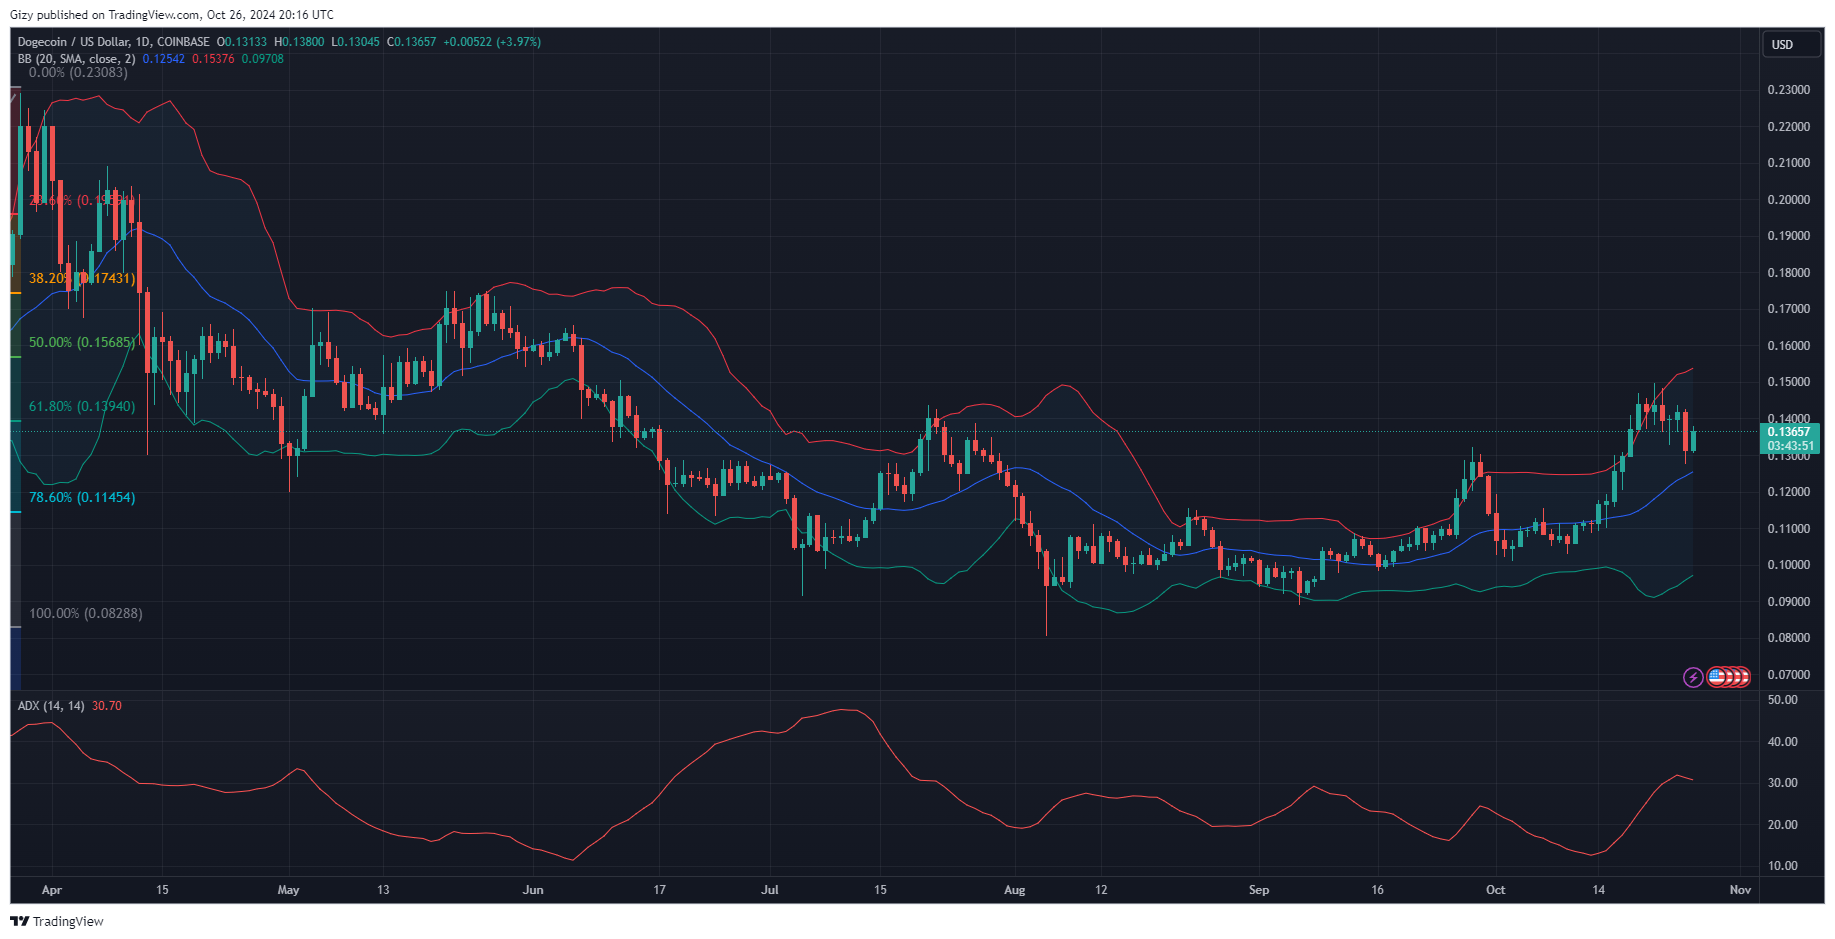
Dogecoin was not exempt from the bearish actions of the previous day that ravaged the crypto market. The largest memecoin opened trading at $0.14 but retraced following a failed attempt at resuming the uptrend. It dropped to its lowest in the last seven days, dropping to a low of $0.127 and closing with losses exceeding 7%.

A closer look at the one-day chart shows several attempts at a bullish push that ended with little or no price improvement. It started Monday with a doji and ended several days with a green dojis. It is down by almost 6% on the weekly scale but shows signs of recovery at the time of writing.
Indicators are still negative despite the ongoing attempts at recovery. One such indicator is MACD. The 12-day EMA continues its downward drive and sinks lower following the recent bullish divergence a few weeks ago. The histogram associated with it shows red increasing bars as it prints sell signals.
The relative strength index is rising in response to the ongoing change in price trajectory. It surged from 55 to 60 as recovery continues. Nonetheless, it reclaimed its first pivot resistance at $0.13. However, the average directional index is on the decline as DOGE loses momentum in the long term.
TRX/USD
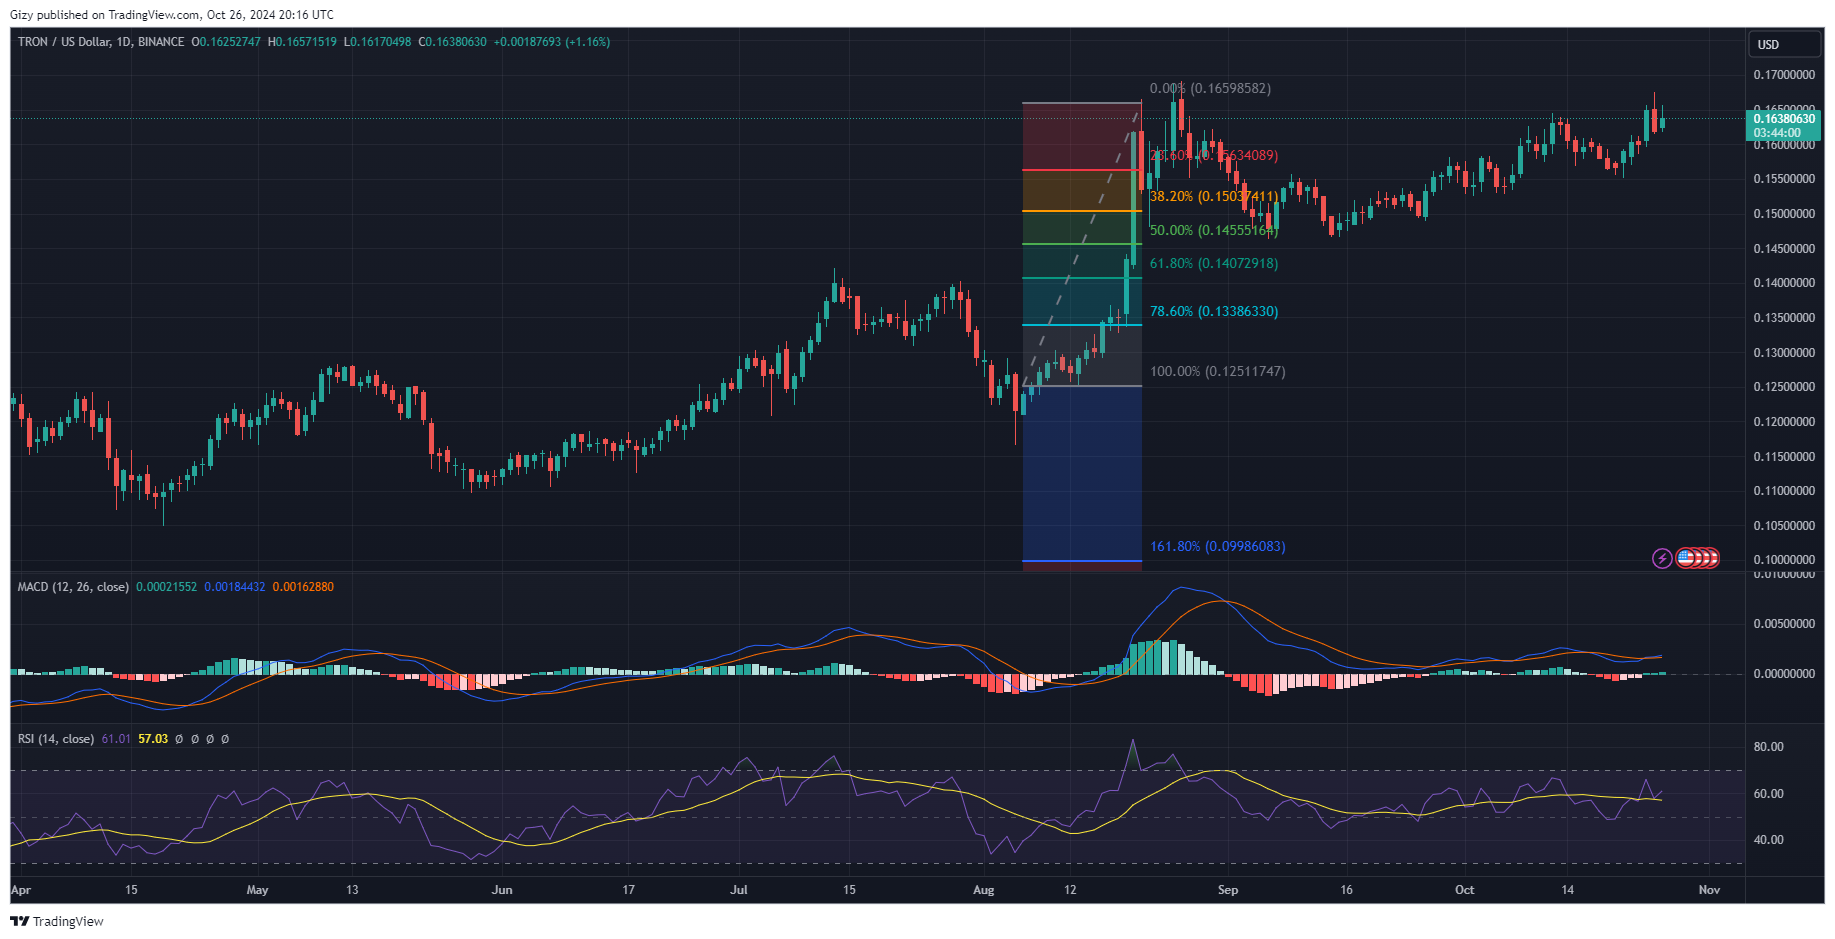
Tron has erased all the losses it had during the previous intraday session. It started the session at $0.165 and surged, peaking at $0.167. It faced massive rejections at the high, resulting in a drop below its opening price, registering losses of almost 2%.

The most recent decline comes barely a day after the coin recorded its most giant green candle. It started Oct. 24 at $0.160 but experienced a significant increase in buying volume, resulting in a surge. It hit a high of $0.165 and closed with gains exceeding 3%.
TRX is currently up by almost 2% as recovery continues. Indicators are also green at the time of writing. One such is the ADX. It is on the uptrend due to the notable increase the altcoin saw over the last five days. It is up by almost 5% on the weekly scale.
The moving average shows the bulls gradually edging in the struggle for dominance. A few days ago, the 12-day EMA intercepted the 26-day EMA. MACD continues printing buy signals as the lower timeframe exponential moving average continues its uptrend. This is also the sentiment on RSI. It is on the rise as buying pressure increases.
TON/USD
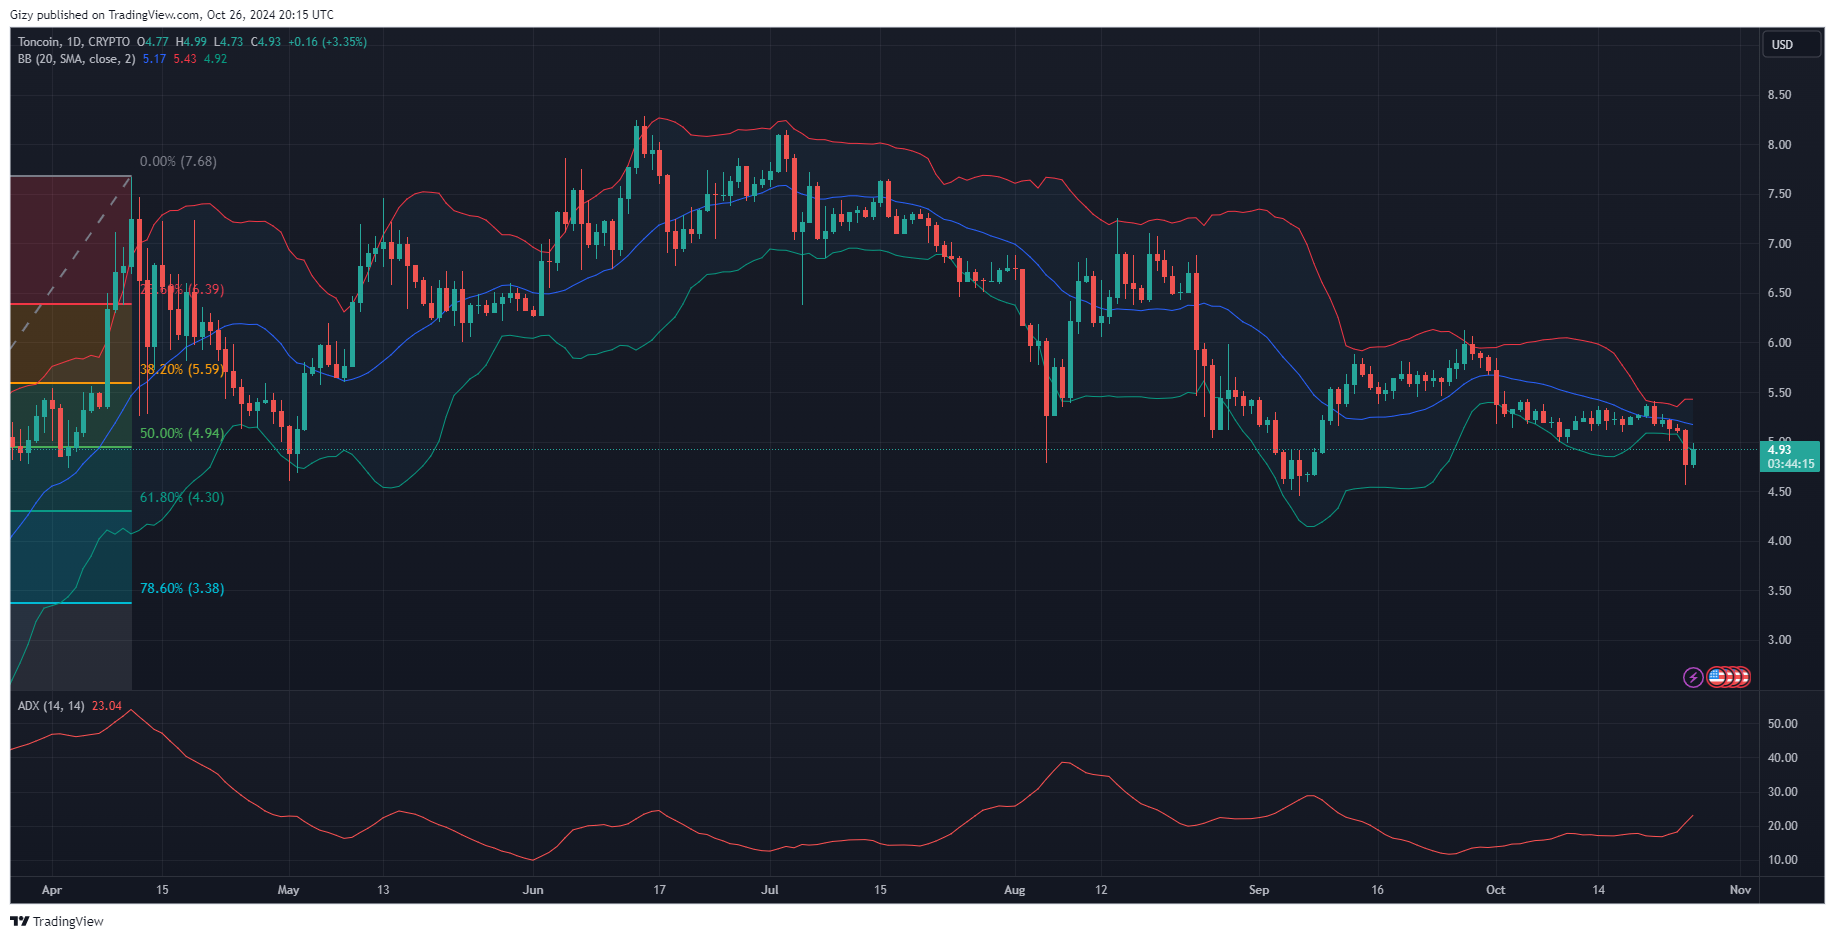
Toncoin was almost oversold during the previous intraday session due to the massive selloffs it saw. The candle shows it was one of the biggest in the last thirty days. It started trading at $5.12 but dropped below the $5 barrier, sinking further and hitting a low of $4.56 before rebounding. Although the altcoin saw a slight recovery, it closed with losses of almost 7%.
A closer look at the one-day chart shows that the asset experienced other significant declines over the last six days. One notable event occurred on the first day of the week when it started trading at $5.36 but retraced to a low of $5.16, closing with losses exceeding 3%. Other similar losses and little attempts at recovery resulted in a more than 8% drop on the weekly scale.
The relative strength index is at 38 after it closed to breaking below 30 during the previous intraday session. The moving average convergence divergence prints sell signals amidst the growing bullish pressure. Both EMAs continued downward following the bearish divergence a few days ago.
Bollinger bands show TON trading below the lower SMA. The bulls may look to resume trading between the middle band and upper. The average directional index is on the uptrend as the altcoin sees notable momentum.
