
DOGE is one of the top gainers in the top over the last 24 hours as it registered significant uptrends. Other memecoins like MOG and FLOKI are also seeing a similar price trend.
Mog coin is up by almost 10% as it climbed above 0.0000021. Floki surged from $0.00014 to a high of $0.00015 but faced small rejections. Nonetheless, it is up by over 7%. It climbed above its pivot point and eyes further price increases.
The global cryptocurrency market cap also saw slight increases in reaction to the latest bullish sentiment. It gained almost 2% as valuations hit $2.35 trillion. Trading volume also surged by over 10% in the last 24 hours.
The fear and greed index rises as traders lean toward more bullish actions. Let’s see how some assets in the top 20 are reacting to the current trend.
BTC/USD
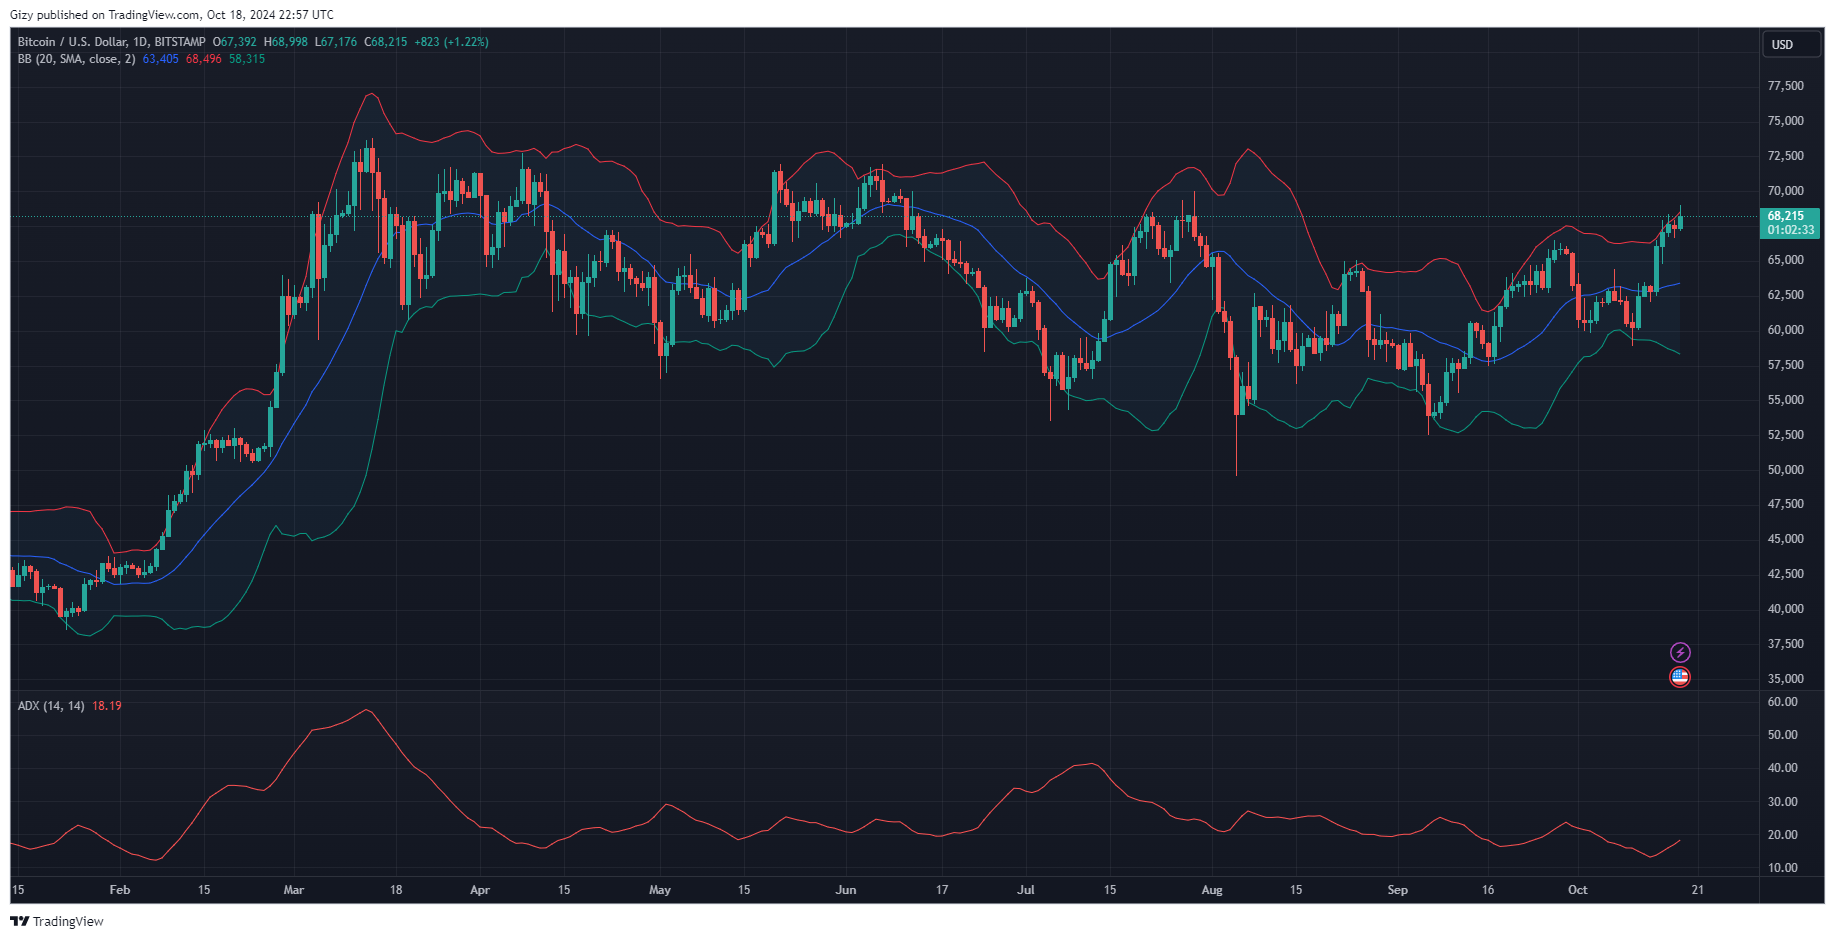
Bitcoin is having its best week since August. It has climbed and flipped key levels, up by over 8% in the last five days. Previous similar gains in September were a little above 7%. The latest reading may hint at renewed bullish vigor.
One contributing factor to the ongoing climb is fundamentals. Data from the betting platform Polymarket shows that presidential candidate Donald Trump is likelier to win the upcoming polls. He gained over 12% lead against rival Kamala Harris. Many analysts suggest that the market is waking to the possibility that the crypto-friendly candidate is taking the lead.
The apex coin started the week on a bullish note, ripping through the $64k barrier on Monday. It started the day at $62,850 and surged, hitting a high of $66k. The asse4t faced rejection at $66,479, resulting in a slight decline. It ended the day with gains exceeding 5% amidst the small drop.
Tuesday saw the cryptocurrency slightly drop, threatening to hit $64,000. However, it rebounded at $64,847 and continued its surge, peaking at a level it hasn’t visited since July. It flipped the $67k. It has since slowed down but continued its gradual increase.
BTC edged close to $69k a few hours ago but faced resistance at $69k. The bulls want prices to hit $70k before the elections. It remains to be seen whether this will happen. However, some analysts believe it’s possible.
At the time of writing, indicators are also positive. One such is the moving average convergence divergence. The 12-day EMA continues its upward trajectory. The trend also reflects on the momentum indicator, which has been at its highest in the last thirty days. However, the RSI is blaring warnings. It is at 69.
DOGE/USD
Dogecoin is bullish at the time of writing, climbing higher and higher daily. It hasn’t printed any red candles since the week started and is up by over 23% on the weekly scale.
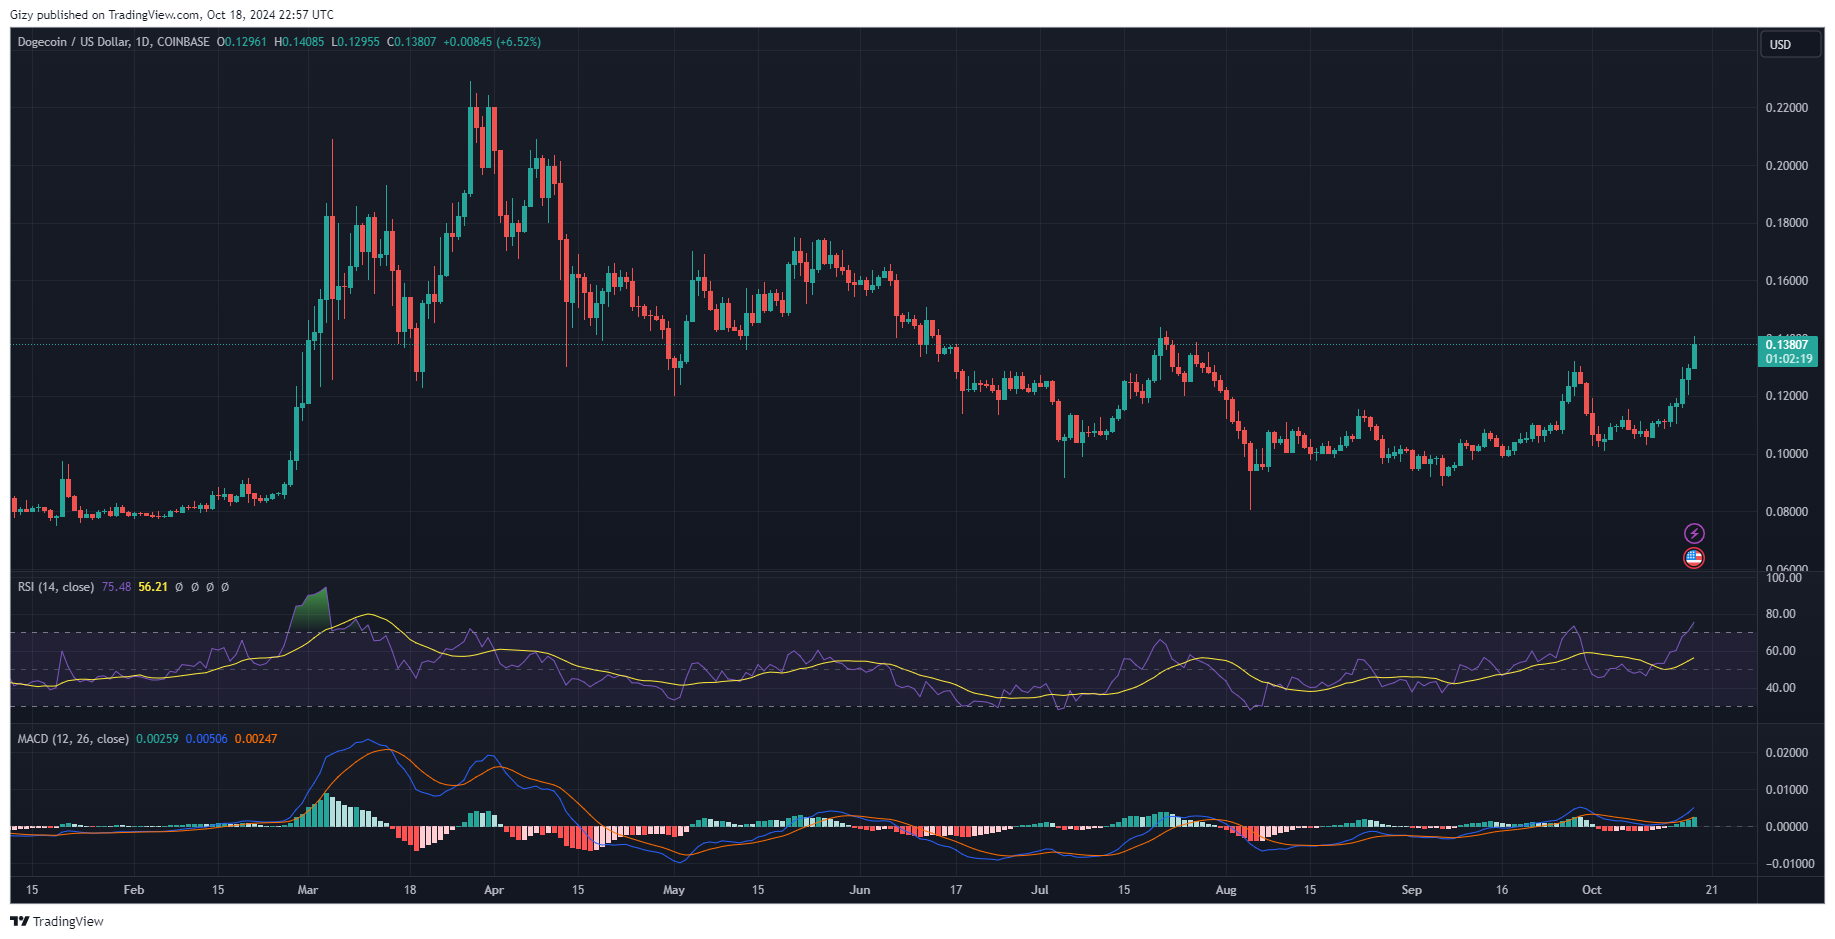
The current uptrend started on Monday as the asset broke out from its six-day trend. It opened the day at $0.111 and edged closer to flipping $0.12 but failed due to notable resistance at $0.117. Nonetheless, it ended the session with gains of almost 5%.
Following Tuesday’s dip, which saw it lose all its accumulated gains but rebound and close at its opening price, the uptrend continued the day. The memecoin broke through the highlighted barrier and continued upward. It briefly flipped $0.130 but failed to sustain the momentum, resulting in a slight decline to a close at $0.125.
Another attempt at $0.130 happened the next day with limited success as DOGE rebounded from $0.12. It closed with gains exceeding 3% following the previous 7% surge.
The hike is ongoing, and the altcoin may reel in another massive gain at the end of the current intraday session. It broke above $0.14 but failed to sustain momentum above it, resulting in a minor correction. Currently at $0.137, it is up by over 6%.
DOGE is also trading above the upper Bollinger band. The average direction index suggests that the bullish strength behind the push is still strong. Dogecoin is overbought as the relative strength strength is at 75.
TRX/USD
The one-day chart shows that Tron registered little volatility over the last five days. Most of the big moves were also downward as it failed to resume its uptrend. It is down by over 2% on the weekly scale.
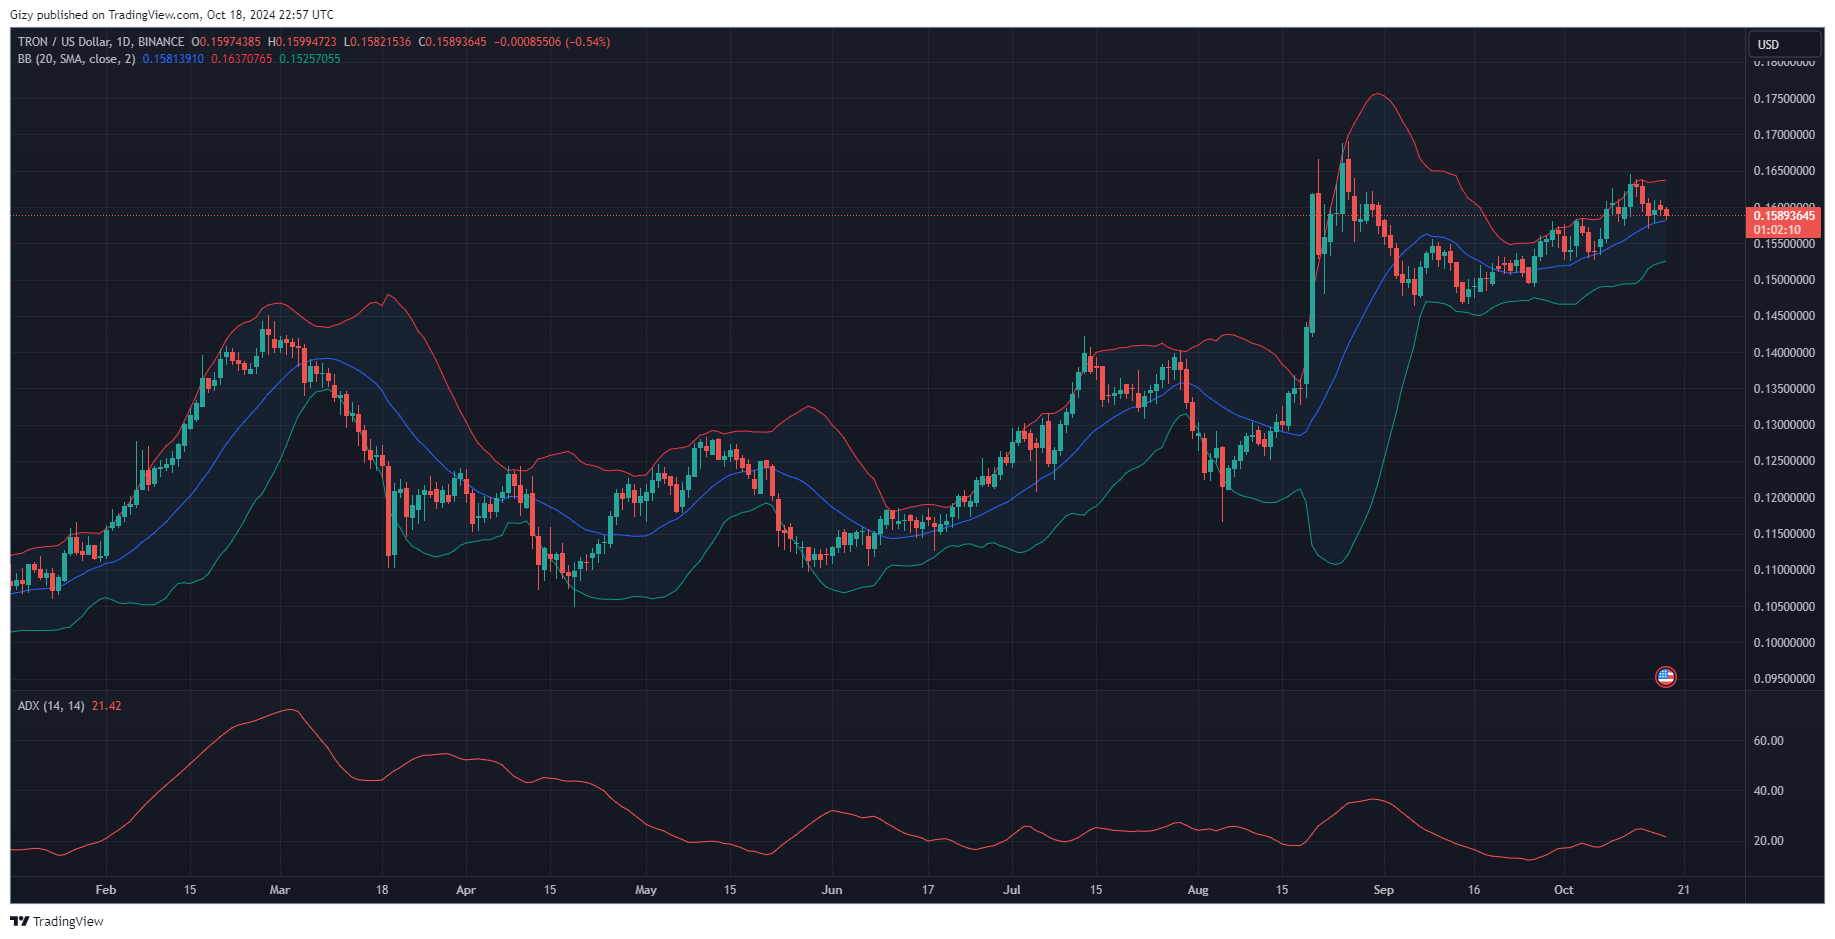
It was off to a bearish start, dropping from $0.162 to a low of $0.159. The coin lost the first pivot resistance at $0.161 but rebounded and failed to fully recover. The decline continued the next day as it dipped further, hitting its six-day low at $0.157. It has since registered very small price movements that translate to a stagnant price over the last three days.
Currently trading below the first pivot resistance, it risks a drop to its pivot point at $0.153 if trading conditions remain the same. Other indicators show minimal increases in pressure from the bulls and bears. For example, the RSI saw very few changes in the last three days. The bulls have also yet to cause any significant price surges and may not anytime soon as the ADX is declining.
The Bollinger band shows the reason for the latest price trend. TRX surged out of the upper band last week. It was due for significant trend change. The altcoin’s current price movement is the needed correction.
TON/USD
Toncoin has received very little interest from investors over the last five days. The one-day chart shows the asset struggling to break out of its horizontal channel. It is also printing a doji on the weekly scale as it is trading at its opening price.
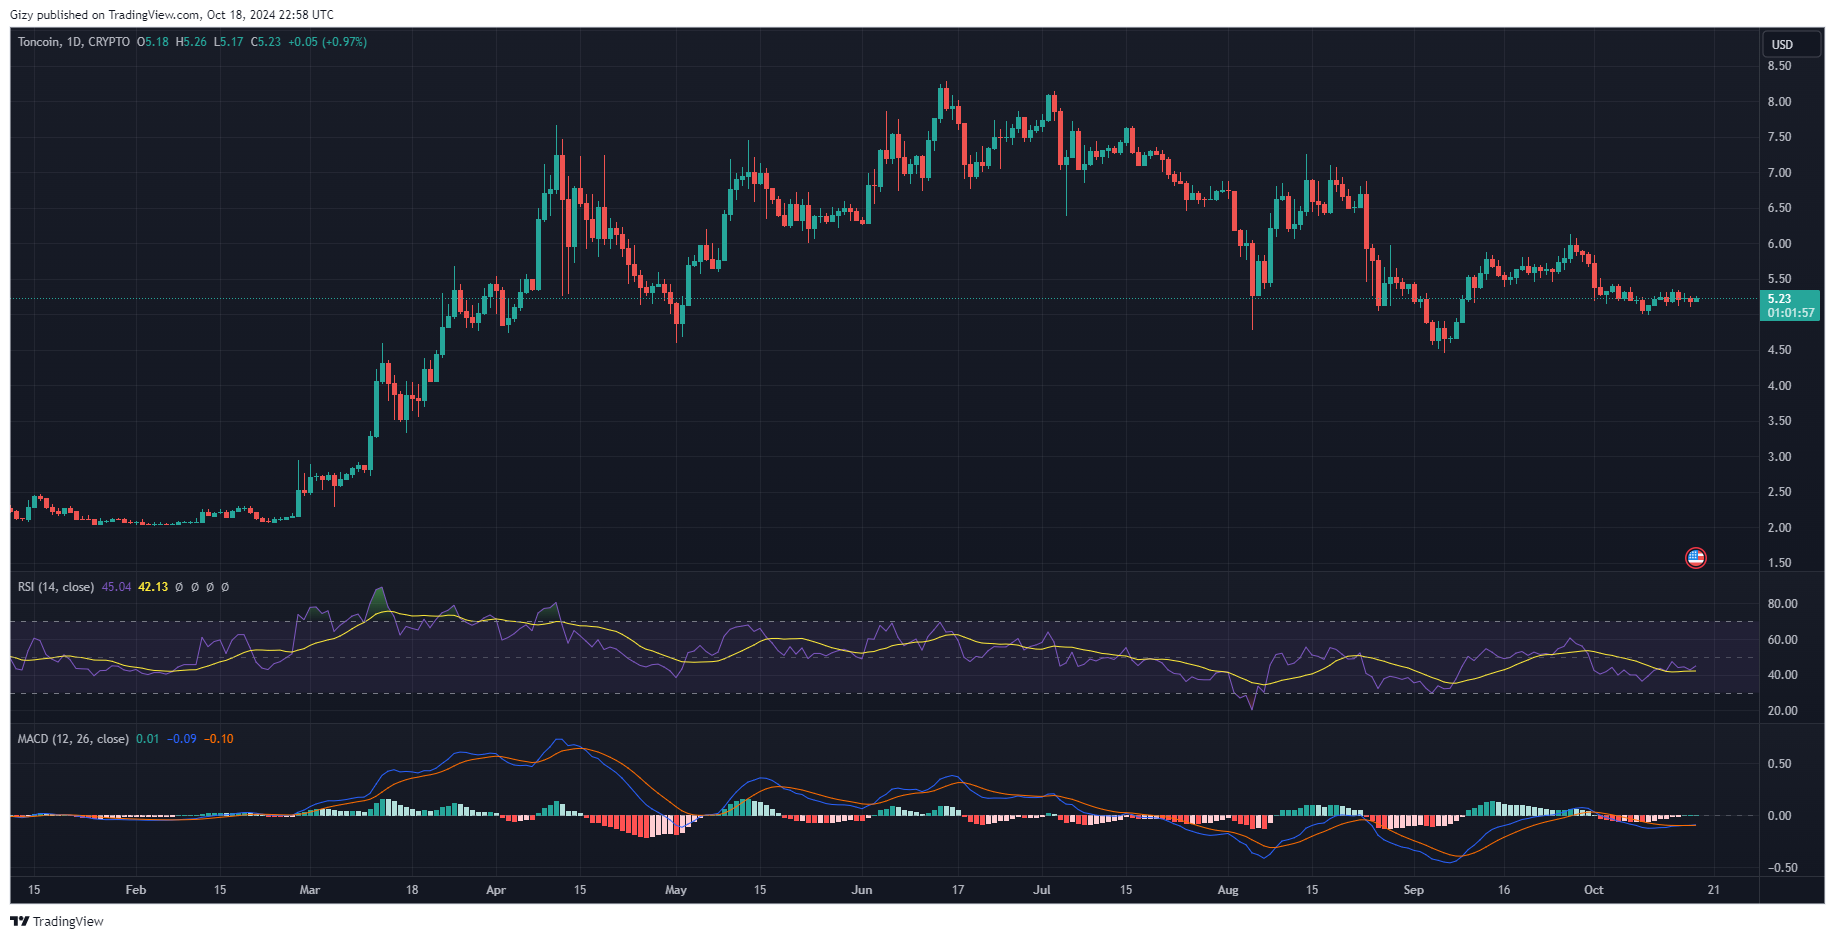
It had a bullish start to the week but failed to sustain. It opened Monday at $5.19 and surged to a high of $5.36. Although it had minor retracement, it closed with gains of almost 3%. The next day, TON lost all the gains as the bears started a selloff.
The altcoin has also failed to register any significant price shifts over the last three days. Nonetheless, indicators like the moving average convergence divergence are printing bullish signals at the time of writing. The 12-day EMA recently flipped the 26-day EMA during the previous intraday session.
The RSI has not responded to the recent bullish divergence, as buying pressure is lacking. The average direction index is bullish at this time as it is gradually rising.
