
WIF is suffering one of its most significant losses in the past month. The coin joins the rest of the crypto market in bearish sentiment as it struggles to overcome some fundamentals.
The market is grappling with the effects of Gary Gensler’s interview. The U.S. SEC chairperson granted CNBC an interview where he made several remarks suggesting that the regulator’s hunt for cryptocurrencies is far from over. He claimed that several cryptocurrencies are securities in the United States.
The latest statement comes barely a day after crypto trading platform Robinhood received a wells notice from the regulators.
The global cryptocurrency market is down almost 2% in response to this negative news. Nonetheless, it’s printing profit on a weekly scale, as it is up by over 4%.
Will the crypto market recover from the current decline?
Top Five Cryptocurrencies to Watch
BTC/USD
Bitcoin’s current market position is experiencing some challenges as it struggles to maintain its price at $63k following the recent statement made by the SEC chairman. Although the trend started during the previous intraday session, the apex coin surged to a high of $65,500. This surge has led to growing speculation of an attempt at $70k, which has gradually gained more attention.
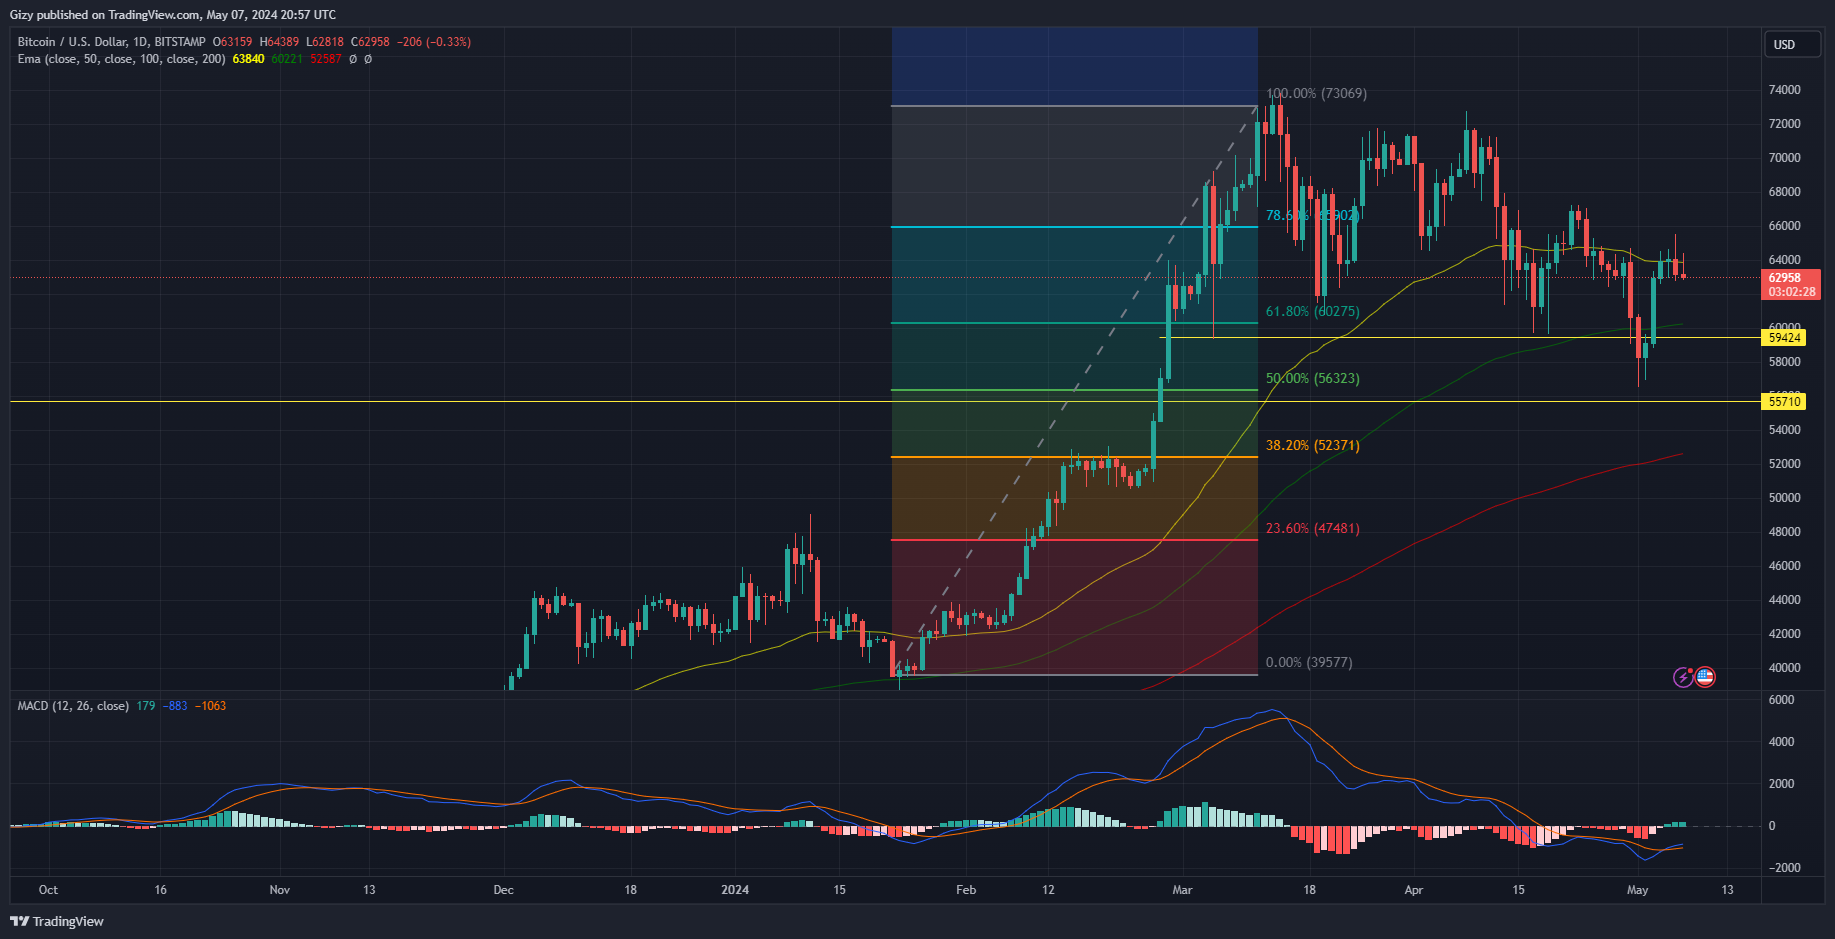
However, the asset closed with losses of almost 2%, which has kept the market bearish. BTC has yet to register any significant changes in value, but it has crossed several metrics that point to further price declines. One of these metrics is the 50-day EMA, in which the asset has failed to close above for the second consecutive day. This consistently places the bears at an advantage.
Coupled with the growing selling pressure on the $63k support, the relative strength index has started its descent in response to the slight increase in selling volume. This has further strengthened the bearish position.
If the current level buckles under pressure, the apex coin will retest the next critical mark at $62k. If the bulls fail to defend the $62k support, BTC will retrace as low as $60k.
On the other hand, it is worth noting that the 12-day EMA is still on an uptrend, which may mean the bulls’ impending attempt at a buyback. If this plays out, Bitcoin may reclaim $65k. However, it’s essential to keep in mind that the current momentum is bearish, and it may take a significant effort from the bulls to turn it around.
ETH/USD
Ethereum is heading for its second consecutive loss since the start of the week. It ended the previous day with losses of over 2% as it failed to sustain prices above $3,200. It retraced to a close at $3,062.
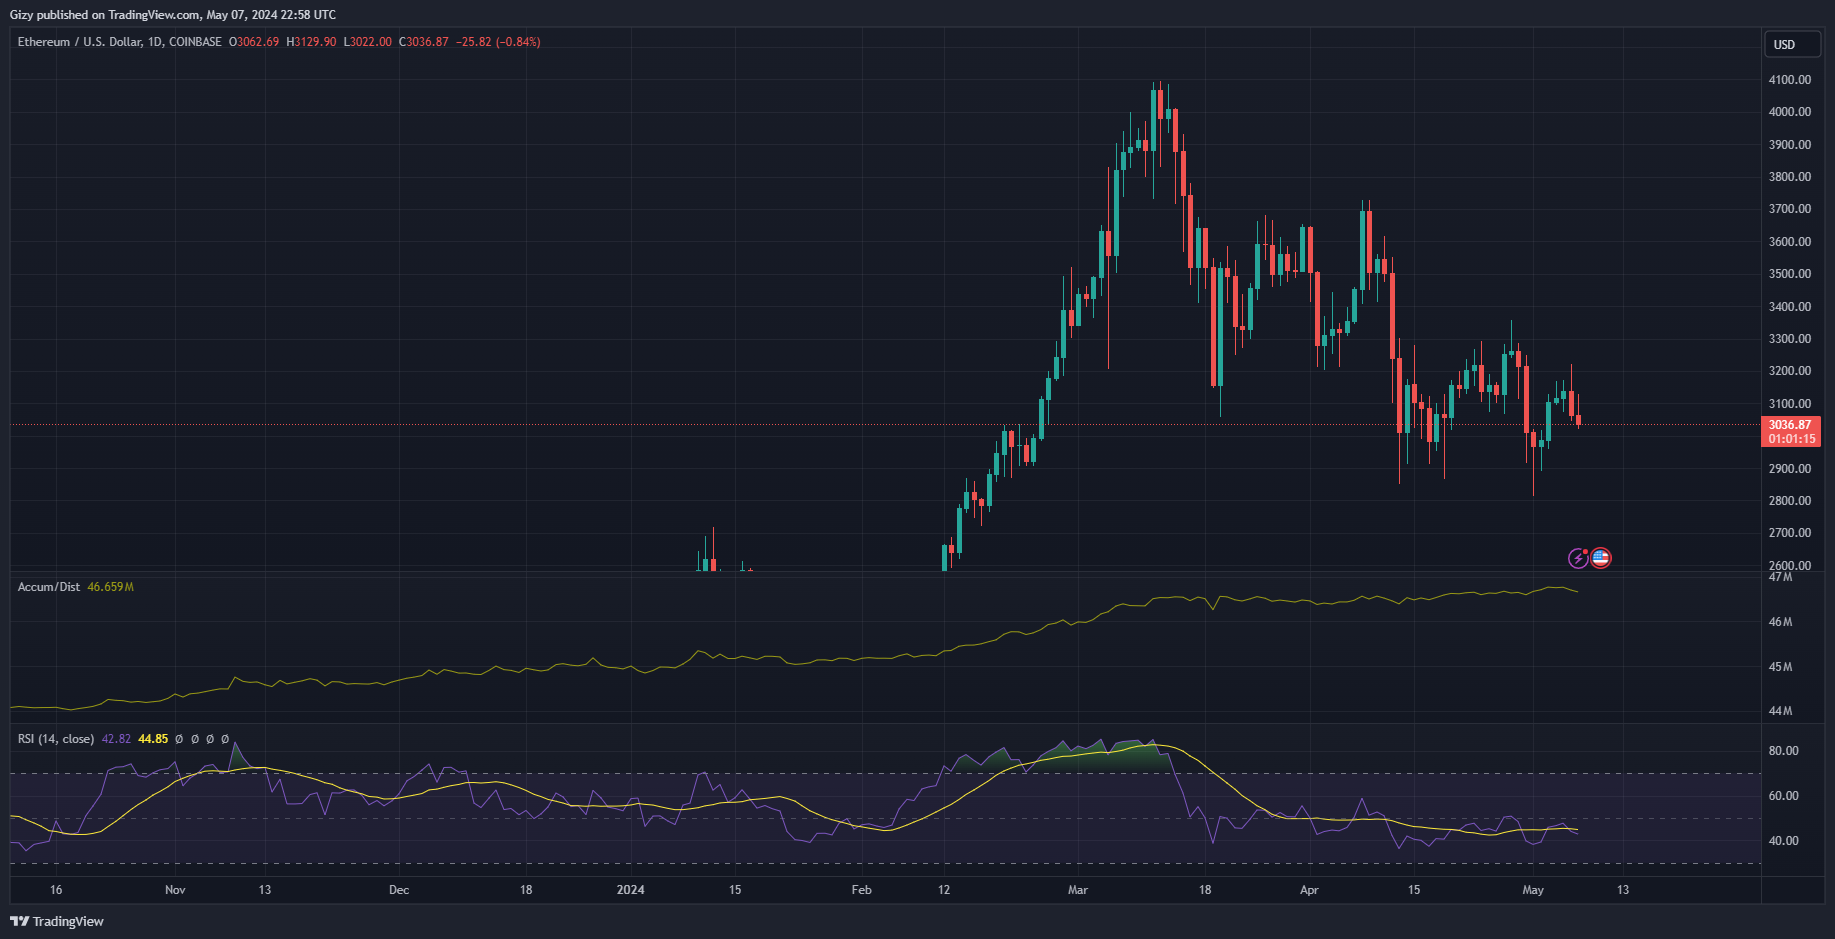
The current-day candle shows that the altcoin retested $3,000 but rebounded at $3,022, coming after the asset peaked at $3,129. Currently trading close to its opening price, the asset is printing a doji as it may end the day with no significant change in value.
ETH also hit a deeper low than the previous day’s which suggests that the coin may be starting a downtrend.
The moving average convergence divergence is hinting at the altcoin going downhill. Following its bullish divergence barely three days ago, the 12-day EMA has halted its uptrend. It is currently trending parallel, indicating an impending bearish convergence as the momentum dwindles.
The relative strength index is also on the decline. It is trending below 50 and at 43 in response to growing selling pressure. The accumulation/distribution channel is also heading downhill, hinting at no upcoming change in trajectory.
The bulls must continue to defend the $3k support to avoid further slips. However, if the highlighted mark breaks, the largest altcoin will retrace as low as $2,900. Nonetheless, the coin will look to rebound at this mark and remain range-bound between $2,900 and $3,100.
SOL/USD
Solana gained over 4% during the previous intraday session as it peaked at $157 following a failed attempt at $160.
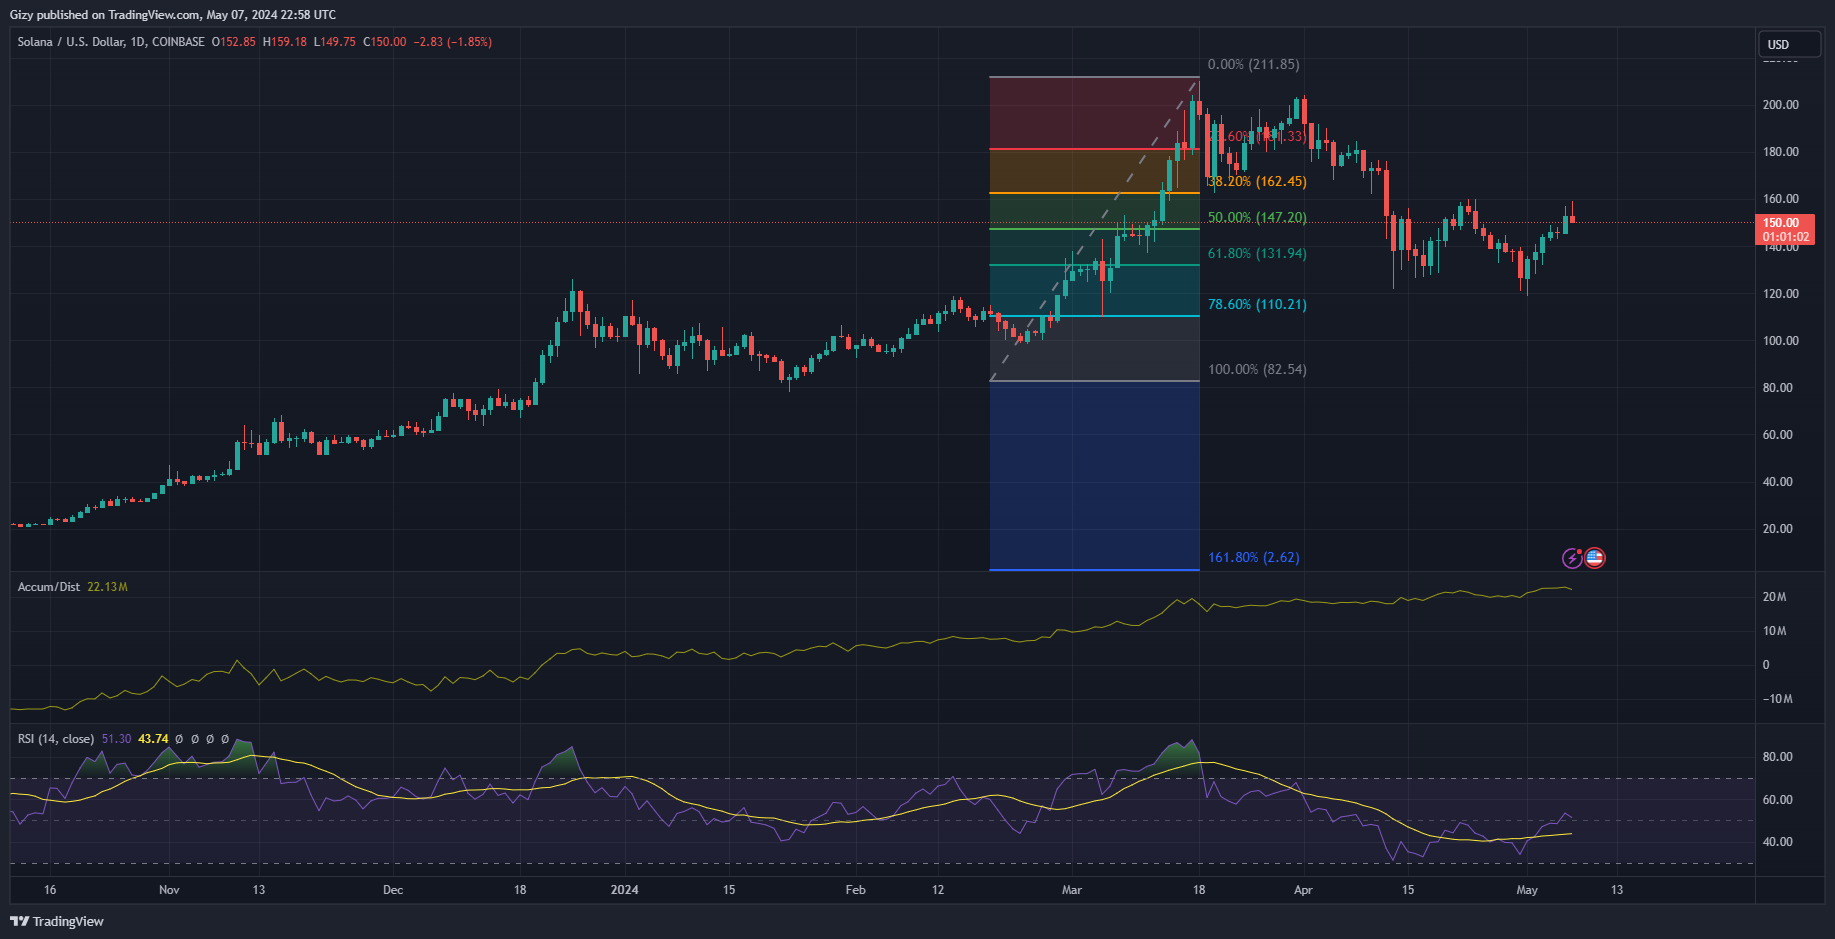
During the current session, it touched $160 but failed to gain stability above it. As a result, it joined the prevailing market sentiment and is on a downtrend. Currently exchanging at $149, the asset is down by over 3%.
RSI suggests that the decline was a result of a significant increase in selling pressure. The metric dropped from 53 to 49 in response to this trend. The 12-day EMA also halted its uptrend and see more declines if the trend continues.
Trading close to the 50% Fib level, SOL will drop below the said level. Nonetheless, the asset will look to rebound at the 61% Fib level at $131.
WIF/USD
Dogwifhat is currently experiencing one of its biggest price declines in the last two weeks. This comes after a bullish performance the previous day, when it hit a high of $3.67. Although it experienced a correction at its peak, it ended the day with gains of more than 4%.
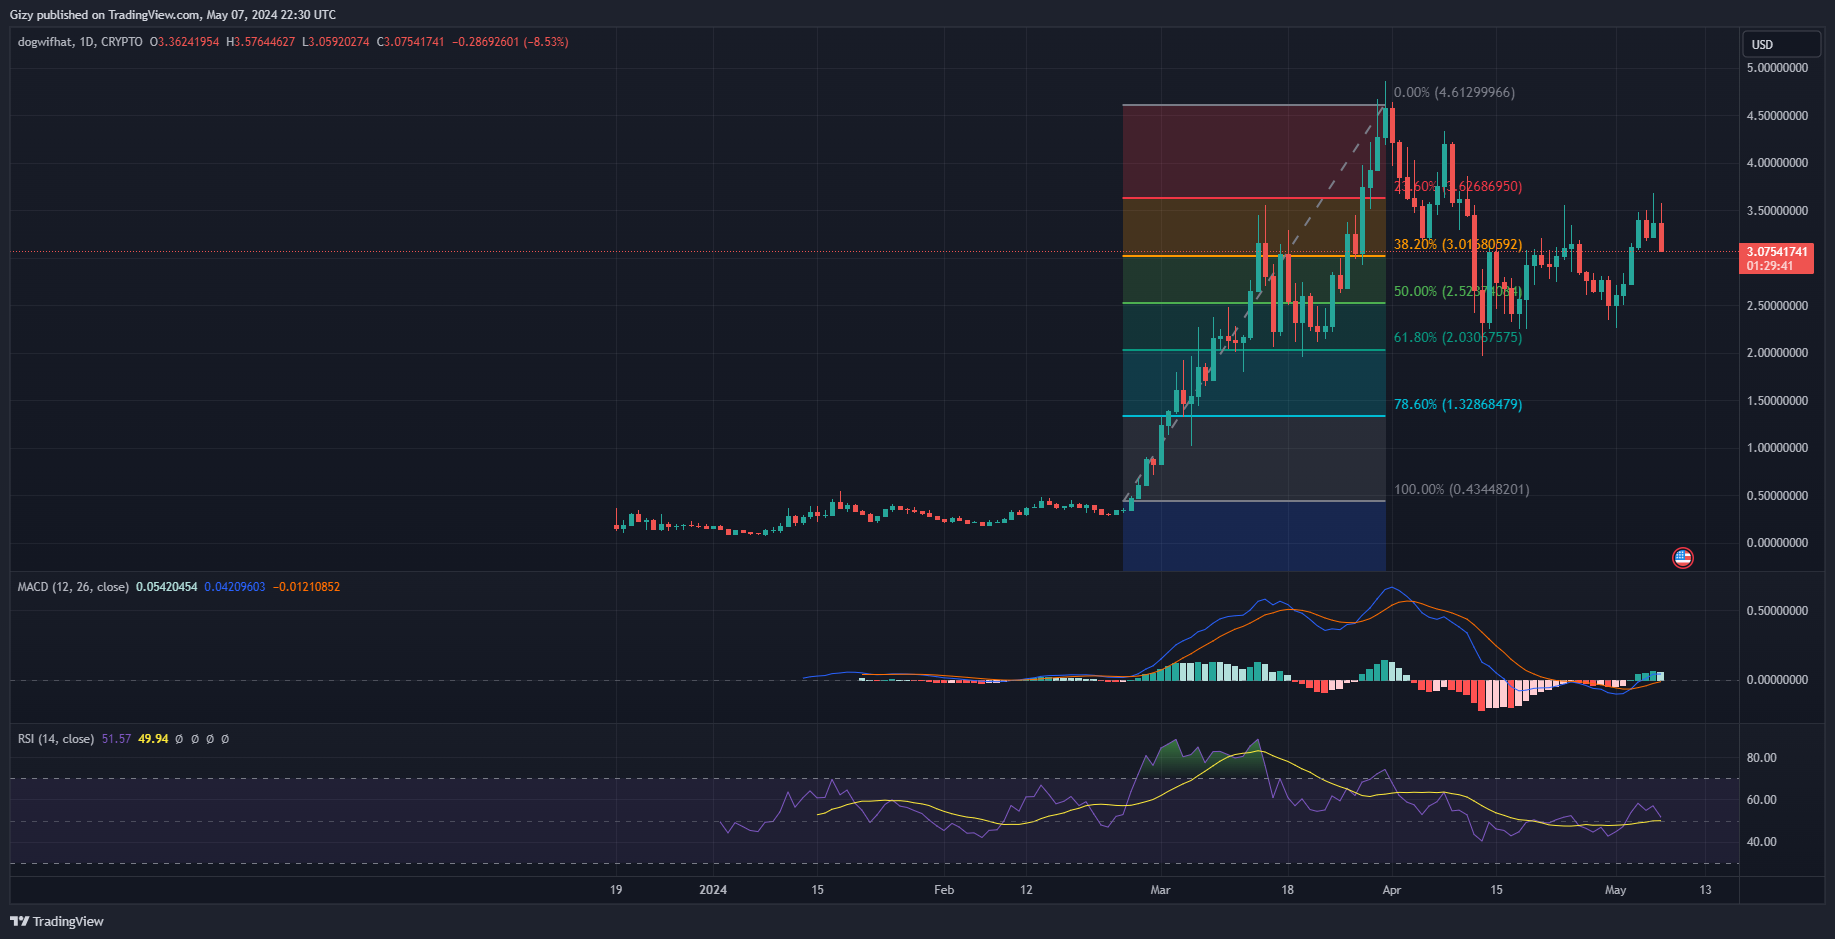
The current day indicates the bears’ increasing foothold on the market. The token hit a high of $3.57 but retraced and is exchanging close to $3. Currently down by more than 10%, the bulls will look to stage demand concentrations at the 50% Fibonacci retracement level at $2.52. If it fails, there are chances it retraces to the 61% Fib level at $2.
However, indicators are pointing to further declines. MACD is printing signals as it is currently undergoing a bearish convergence. With the 12-day EMA trajectory, it will come in contact with the 26-day EMA within the next 72 hours if the current trend continues.
Additionally, RSI is also on the decline. It dropped from 57 and is trending at 50. Although at equilibrium, it indicates at room for more price decline. Nonetheless, previous price movement suggests that the coin will become range-bound at $2.75 as the bulls will attempt recovery.
RNDR/USD
Render (RNDR) is an AI token that has been gaining traction in the market recently. Its value has surged upwards from a low of $6.88 to retest $10, and it has registered gains of over 23% in the last week. RNDR has since stabilized and is currently trading above $10.
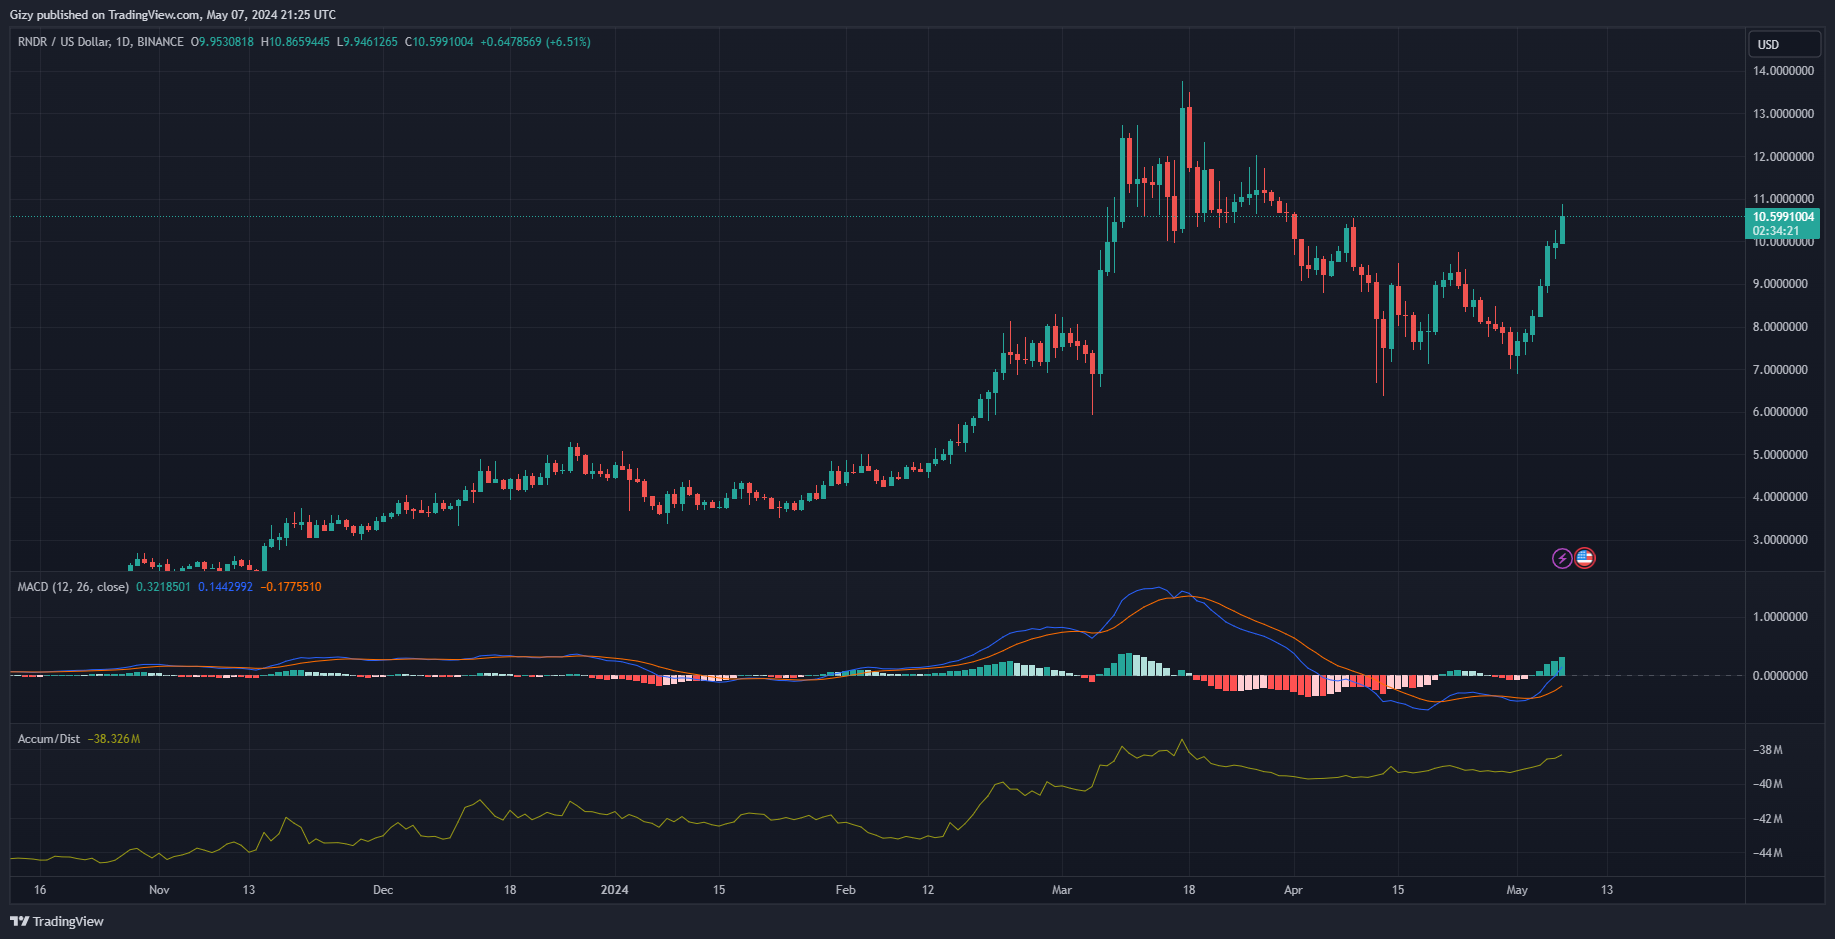
In the past few hours, the token retested $11 but fell short at $10.5 as it lost momentum. However, the accumulation/distribution metric indicates that the uptrend is driven by pure demand, as the metric is rising in response to the current price movement.
Furthermore, the moving average convergence divergence metric maintains its positive posture and displayed a bullish divergence a few days ago. This suggests that the bulls will continue to drive the surge in value.
While the bears may attempt to sell-off at $11, this mark is not challenging, and RNDR is expected to climb as high as $12 within the next five days. However, it may fail to flip decisively.
If there is a change in price trajectory, the asset may retrace, and previous price movements suggest that there is a notable demand concentration at $9. Overall, RNDR’s recent performance has been promising, and it will be interesting to see how it continues to evolve in the coming days.
