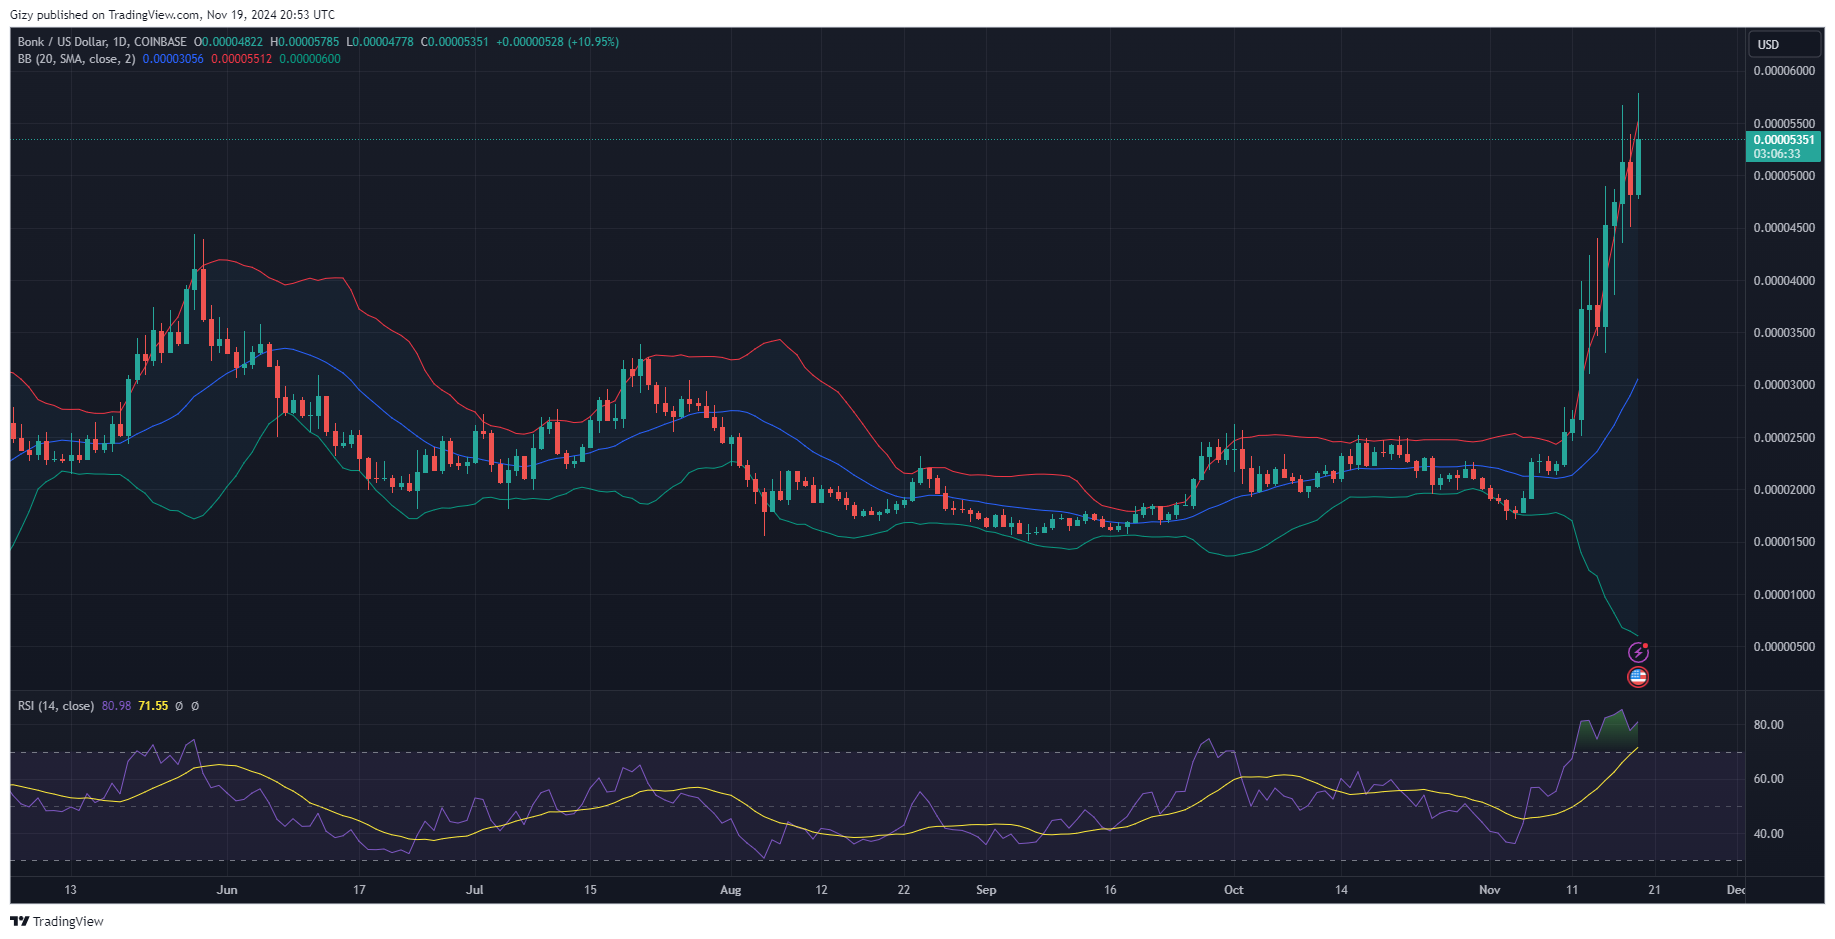
Bonk is trading at $0.000051 after it attained a new all-time high. It started the day at $0.000048 and surged after a slight decline. The memecoin climbed above $0.000055, breaking its previous ATH to register another at $0.000057.
The latest milestone happened barely two days after recording a similar feat. It started trading on Sunday at $0.000047 but retraced to a low of $0.000043 before rebounding. Nonetheless, it surged above $0.000050 for the first time since December and peaked at $0.000056.
The asset experienced a cooldown during the previous intraday session, losing almost 6% and dropping to Sunday’s low.
BONK’s latest uptrends come amidst growing bullish sentiment across the crypto market. It has been on the rise since Nov. 5. It registered one of its biggest increases on Nov. 12, when it opened trading at $0.000026, surged to a high of $0.000039, and closed with gains exceeding 39%.
Why is Bonk Up Today?
Fresh investment is pouring into the crypto market. A recent report suggests that retailers are becoming more active. Coinbase climbed up the ranks of the most downloaded apps on the iOS store as fresh small-time investors pump funds into the industry.
One of the sectors that have made waves over the last six months is memecoins, and new buyers flock in a bid to make 10x off their initial investments. BONK falls in this category and receives a good chunk of the ongoing inflow.
The latest price surges correlate with the latest moves from Bitcoin. The asset benefits from the latest attention price increase the apex coin sees and moves in the same direction.
What Indicators Says
Indicators are currently blaring warnings. The relative strength index surged above 70 on Nov. 12. It continued above the mark, peaking at 85 a few days ago. Currently at 80, the asset remains overbought and is due for massive retracements.

The Bollinger band’s upper band was at $0.000030 last week, and bonk broke above it. It has since continually surged above it, and the current session is no exception. Trading close to the upper SMA is a trend that happens mostly when an asset is due for correction. It remains to be seen if the same will play out this time.
