
BNB is trading at $662 at the time of writing, down a few percent from its high. Nonetheless, it attained a milestone a few hours ago.
It opened trading at $651 and surged to a high of $678. The 4-hour chart shows a notable increase in buying pressure in the early hours of Friday. However, the upward momentum slowed at $667.
Responding to the struggles at this key level, one prediction noted significant selling pressure and warned of an impending decline. BNB’s high is proof that it broke above the resistance, but the uptick was short-lived.
The altcoin has since shed more than half its previous gains and is now threatening further decline. Nonetheless, the hike to $678 was the first of its kind since Feb 5; effectively registering a new 5-week high.
In hindsight, the asset has been range-bound for most of the last thirty days. The first breakout occurred last week, when it surged to a high of $668, but it returned to the channel the next day. Its recent surge reinforces the view that it may see further increases in the coming days.
At the time of writing, the altcoin trades at $656. The mark was a resistance during the 30-day consolidation. If it maintains momentum above this key level, it may be gearing up to move higher.
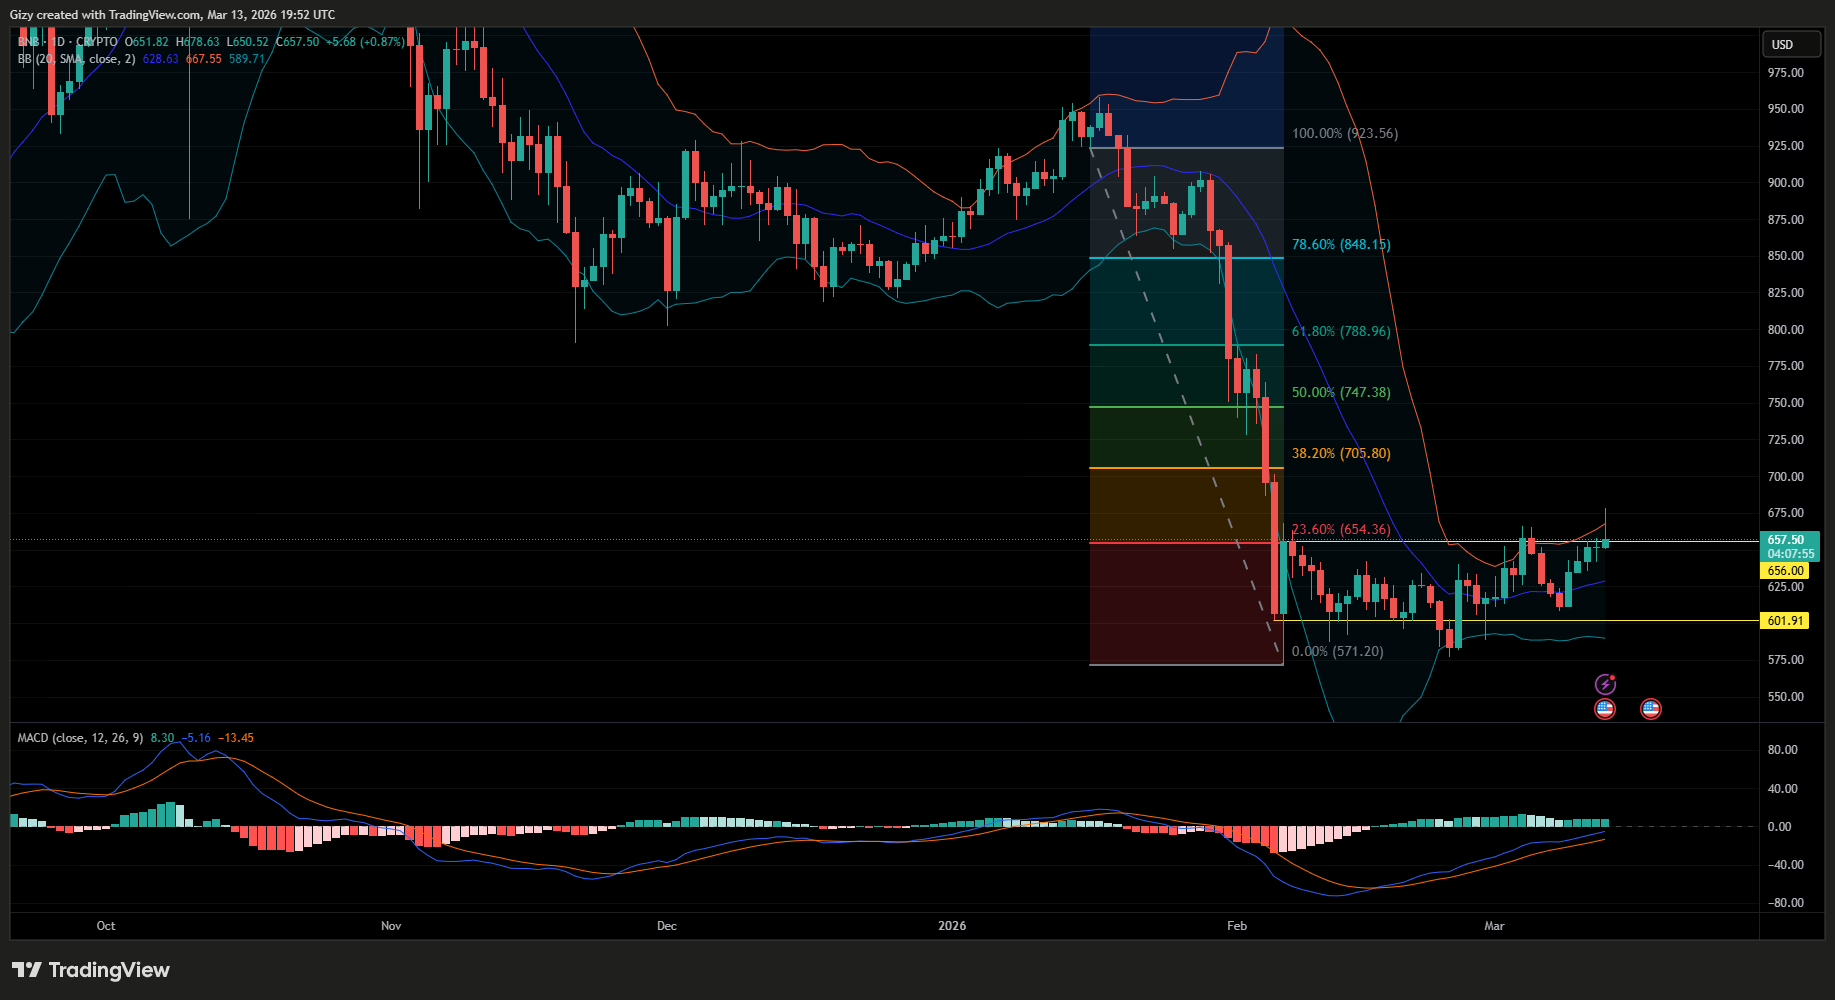
The fibonacci retracements level agrees with this prediction. The chart above shows that BNB has been locked below the 23% level. If the bulls sustain the current momentum above the boundary, the next level to come under test will be $700.
Additionally, the moving average convergence divergence prints buy signals. It nears new highs and maintains its bullish structure amid the price fluctuation. However, onchain analysis and other indicators suggest that the current hike lacks a solid base.
BNB Cost Basis Map Shows Sparse Accumulation
Data from Glassnode suggests that while the latest hike thrilled many, the buying volume remains sparse. The image below shows the cost basis for recent accumulation, as depicted by the green lines at the bottom.
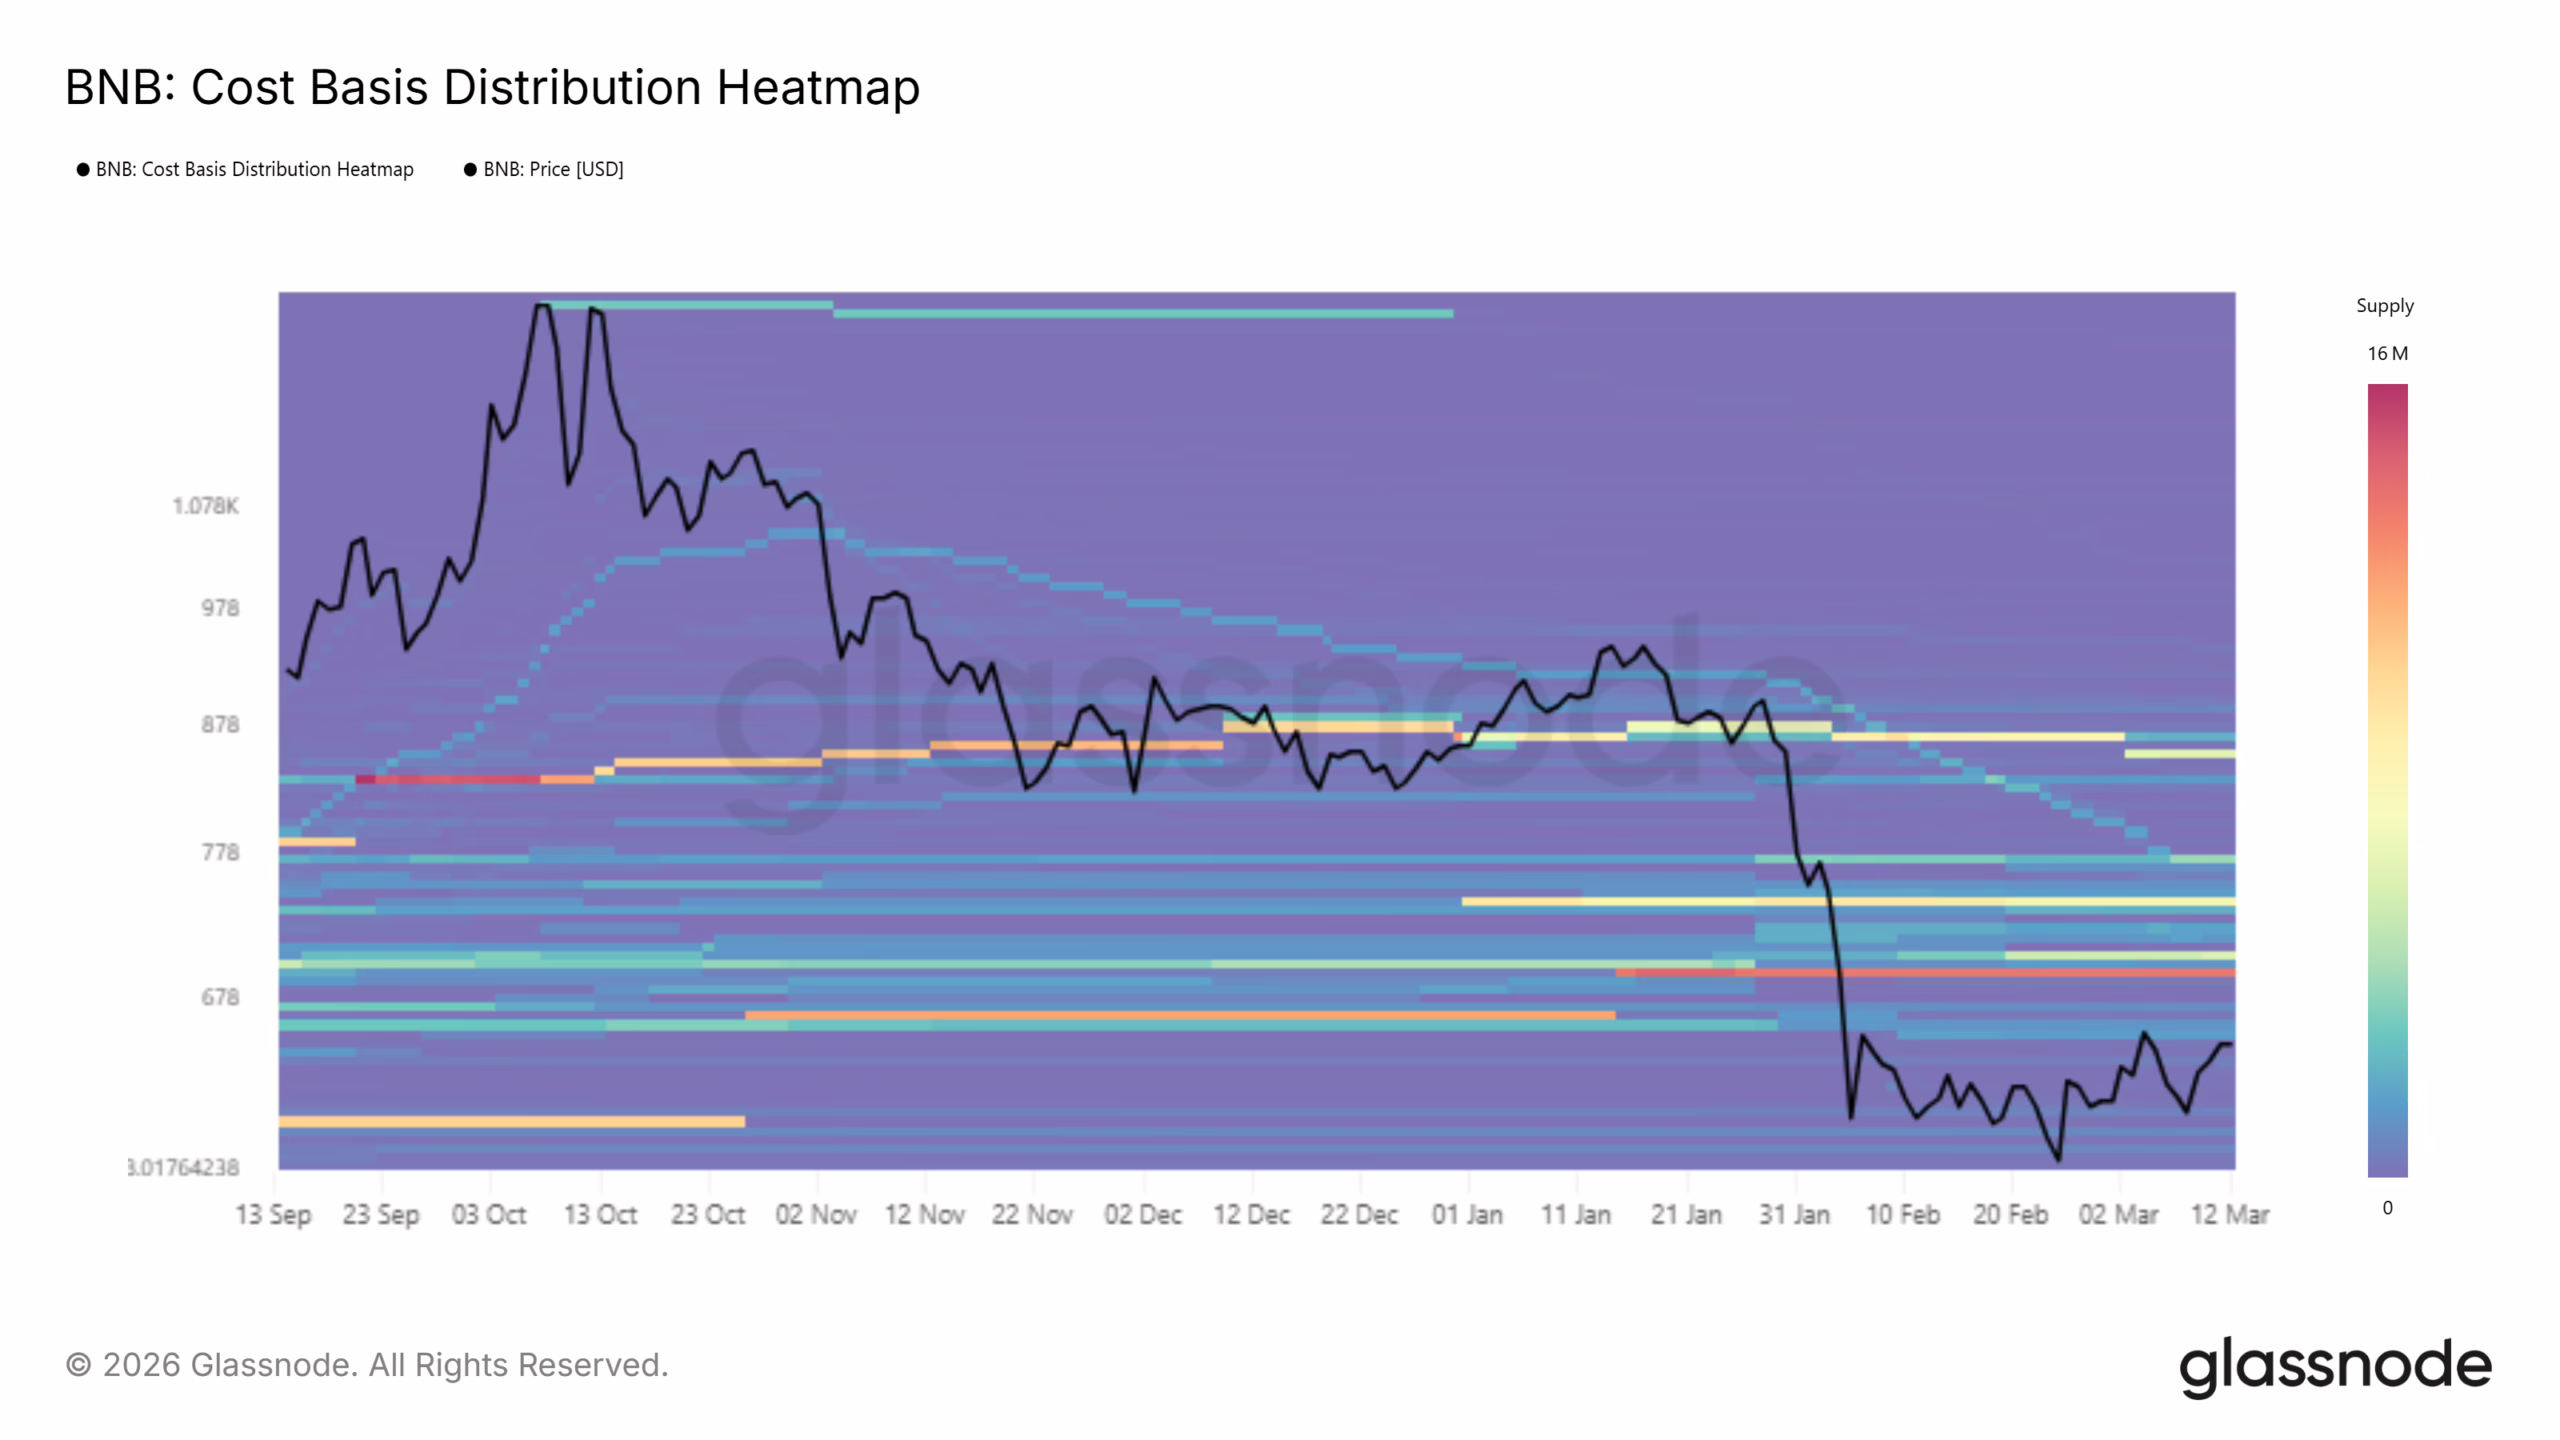
The lines are a lighter shade as the bulls are not aggressively stacking up the asset at these levels. Nonetheless, above the current price lies a region with significant demand concentration. The coin saw more buying between $658 and $665.
If prices remain within this range, the likelihood of further increases in the coming days remains high. However, a plummet below $650 will increase the chances of a drop below $600.
Aside from the cost basis, the Binance Smart Chain is yet to see any increase in activity in relation to the current price hike. The TVL has not significantly increased over the last three days, and DEX volume remains stable.
These data point to one thing: investors’ confidence is still low, and they remain unconvinced by the latest surge. As a result, a massive downtrend may follow if prices slip below the CB range.
On the 1-day chart, the Bollinger bands suggest that a trend reversal is overdue following the recent four-day uptrend. On a 1-week scale, the altcoin is trading almost 8% above its opening price. Nonetheless, BNB recently broke out of the upper band, and as such, a correction will follow
Get Trending Crypto News as It Happens. Follow CoinTab News on X (Twitter) Now


