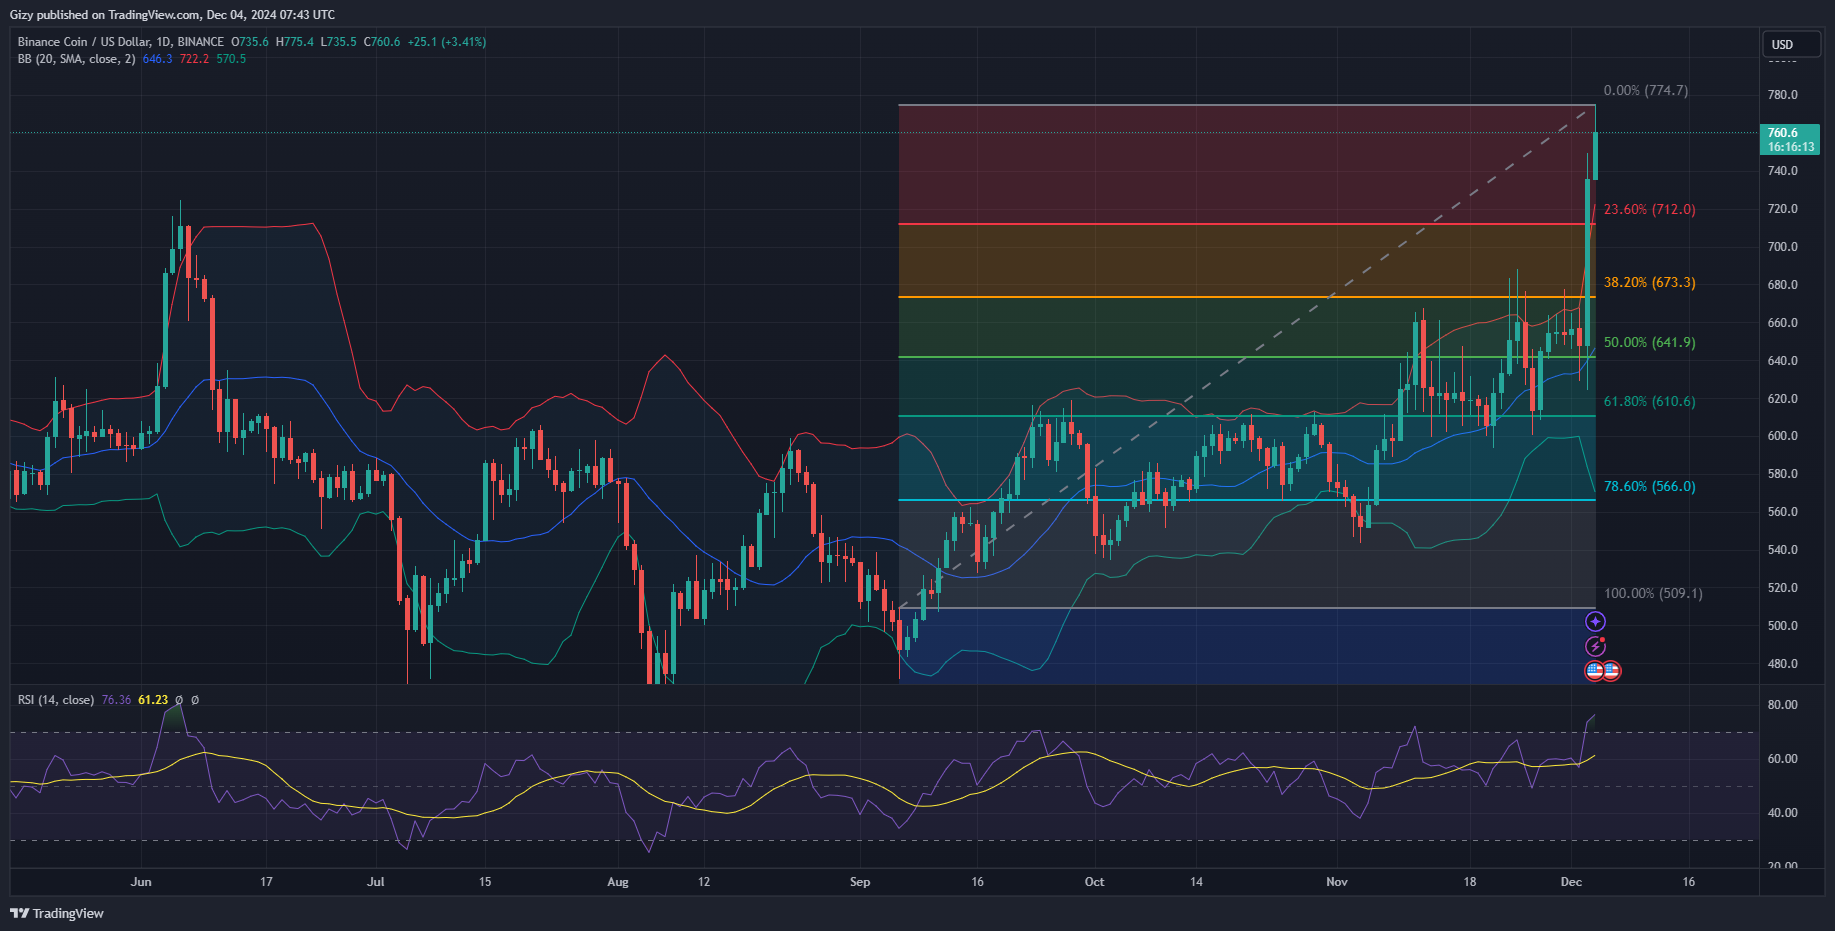
BNB attained a new milestone, barely five hours from the time of writing. It crushed its previous all-time high during the intraday session and repeated the action,
It started Tuesday at $648 and faced massive selling pressure, which resulted in a dip to $624. It rebounded and broke above its six-month high and previous ATH at $724. The uptrend continued with assets breaking above $740, peaking at $749.
The uptick is ongoing, with BNB hitting fresh highs. It broke above $750, hitting a high of $775 a few hours ago. The new milestone is no surprise, as indicators indicate a massive spike in trading activity. It had an over 150% increase in trading volume over the last 24 hours.
The community remains very optimistic amidst the growing selling pressure the asset is experiencing following the new ATH. Speculation of the asset going higher fills the crypto space. Some predict a surge to $1,000, while others suggest a peak at $2k this cycle.
BNB May Experience Pullbacks
The candlestick representing the trading session shows the asset experiencing a slight decline after attaining the milestone. It retraced from a high of $775 and now trades at $757. Nonetheless, it is up by almost 3%.

The Bollinger bands rapidly expanded as the asset gained momentum and saw massive volatility. BNB currently trades above the upper band, suggesting it is due for correction. It is worth noting that the upper SMA is at $720.
The relative strength surged above 70 during the previous intraday session, hitting a high of 73. It is at 75 at the time of writing, showing that the asset is overbought. Traditionally, an overbought asset is bound to see corrections. The sixth-largest cryptocurrency was overbought, with RSI hitting 72. It lost almost 10% before resuming its uptrend.
The Bollinger band suggests a possible decline to $720. The Fibonacci retracement points to notable demand concentration at $711, hinting at a potential dip to this level.
