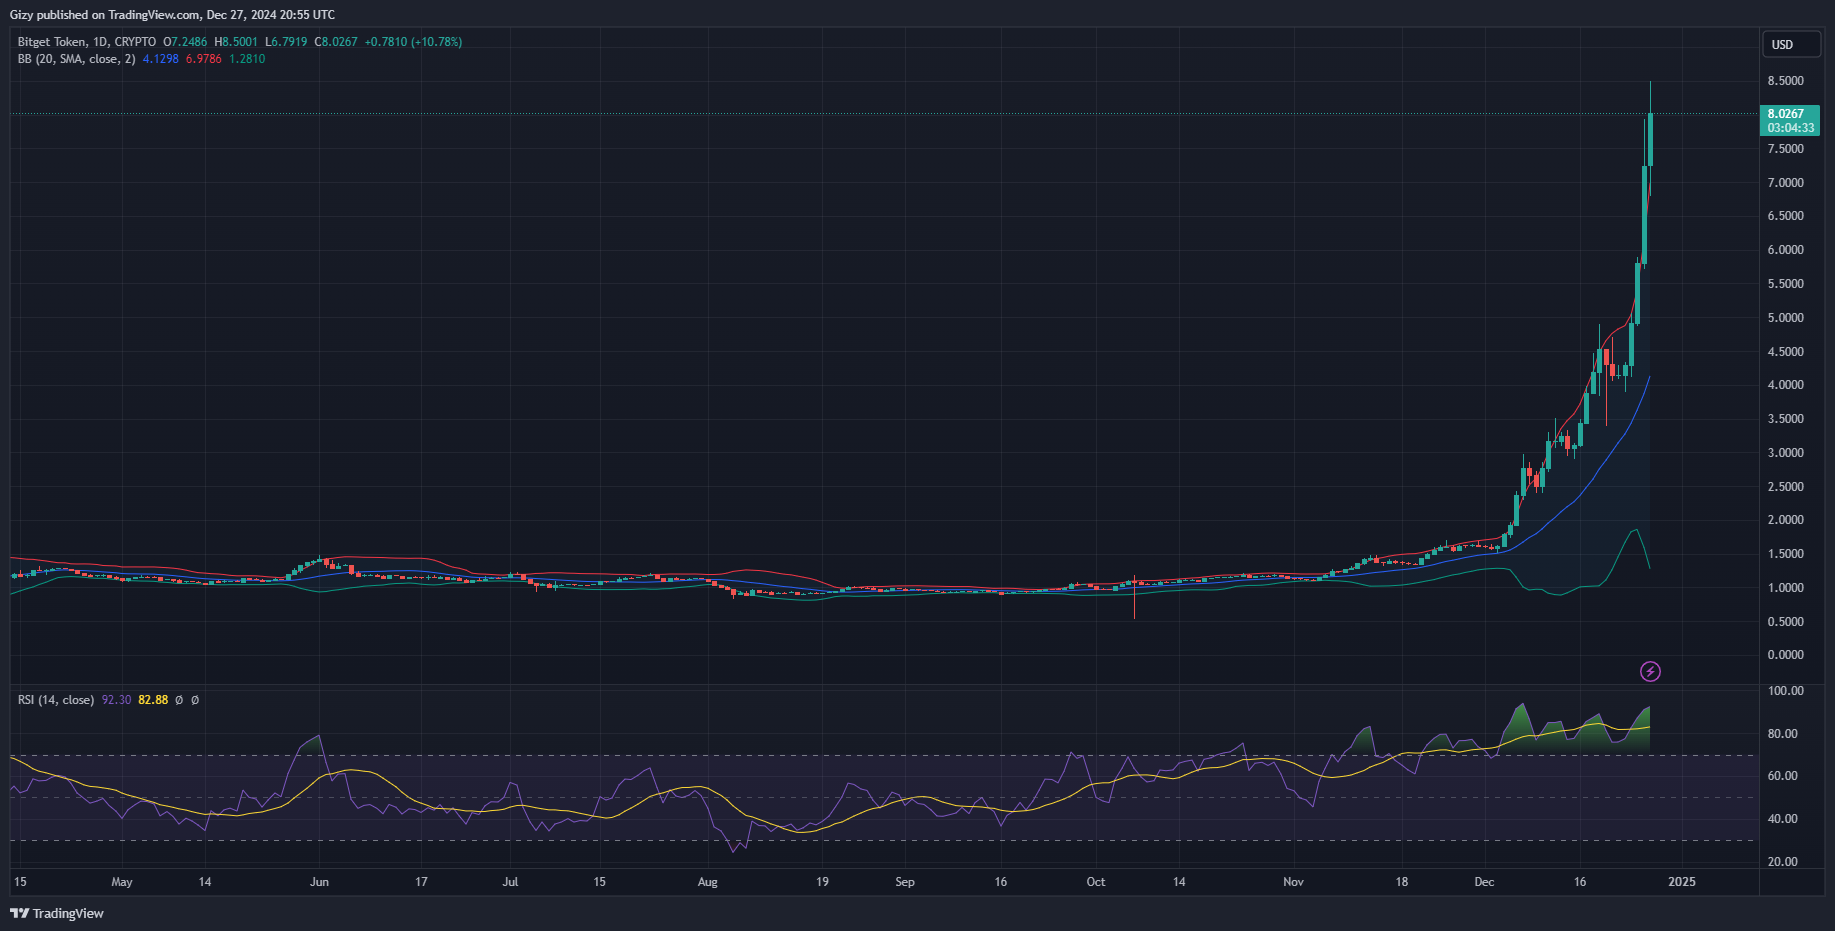
Bitget token opened Friday trading at $7.24 but retraced to a low of $6.79. It rebounded, shooting up to a new all-time high.
The BGB/USD pair broke above the $8 and peaked at $8.50, the new ATH. It experienced a notable decline in value since hitting the high as investors took profit. Nonetheless, prices remain stable at $8.15 at the time of writing.
The current intraday session marks its fifth consecutive green. The surge, which started on Monday, progressively grew over the next three days. BGB gained 14% as it broke above its previous all-time high on Tuesday, peaking at $5.06.
It attempted $6 the next day but faced small resistance at $5.89. It breezed past the barrier on Thursday. The surge continued with the asset breaking the $7 mark but halted due to significant selling pressure at $7.93. Nonetheless, it closed with gains exceeding 24%.
Fundamentals were the primary triggers for the massive increases. On Thursday, Bitget announced the merger of Bitget Wallet Token and Bitget Token. The move, which the exchange said was in response to recommendations from the community, will enable the BWB holders to share in the benefits of the Bitget ecosystem.
Following the merger, BGB will unlock its onchain application as the exchange’s fuel. The swap from BWB to BGB happened between Dec. 19 and Dec. 25. Bitget token surge started during the final few days of the swap.
Data from Santiment show that the crypto market buzzed on news of this merger. One reason for the buzz is the promise of more utility, which may drive prices higher. With an impressive 844% surge this year, investors expect more.
Bitget Token to See Further Increases
The BGB/USD pair is experiencing peak volatility at the time of writing. It broke above the bollinger bands on Wednesday and continued above it. The indicator expands to accommodate the increasing volatility. It sees massive trading volume and price action, suggesting that most is buying action. Nonetheless, trading volume is significantly lower than the previous day.
While many may interpret the decreasing trading volume as the bulls becoming exhausted, others attribute it to the lesser volume the crypto market sees on the weekends. The community remains optimistic amidst the unfolding event.
Other indicators, such as the moving average convergence divergence and accumulation/distribution chart, are positive. MACD is on the rise, and both associated EMAs are hitting new levels. The A/D chart shows peak buying from investors with no signs of selling congestion.
The average directional index reveals that the upward drive may continue for longer as traders sustain the current momentum.
All highlighted indicators point to further price increases. Based on the current trajectory, BGB may break above $10, with the sight set at $12 before December ends.
BGB Risks Downtrends
The token trades above the bollinger bands due to its massive uptrend but risks further descent. An asset trading above the bands is due for corrections. However, when the downhill movement starts, it is a question that only time will answer.

The relative strength index trends at 92 at the time of writing. It broke above 70 in November and has since continued above it. Bitget token is overbought, increasing the risks of a downhill movement in the coming days. It may retrace as low $6 if the downrend start in the next 24 hours.
