
Bitcoin registered a steeper low a few hours ago. It dropped below $117k, but rebounded at $116,856 and trades slightly at the time of writing.
The apex coin continues the previous day‘s downward momentum. It recorded losses exceeding 4% on Thursday as the market took a dark turn following the coin’s ATH.
However, worries about how prices will play out are rising as BTC enters day 2 of its downtrend. Its price actions over the last 48 hours showed signs of uncertainty among investors. Nonetheless, the coin is receiving less attention at the time of writing.
The candle representing the current day’s action carries no significant price change. It is also red, indicating that the bears are still in control. Data from CoinMarketCap shows that the asset is seeing a massive 34% drop in trading volume.
While this is normal on the weekend, Bitcoin has registered notable spikes during this period on several occasions. The coming two days may play out the same way.
Bitcoin to $127k
Bitcoin’s current price indicates that it is more than $6k away from its all-time high. It is worth noting that the asset registered a new all-time high of $124,517 on Thursday. While the calls for a new ATH after this mark are low, new data suggests that the apex coin will surge higher.
Recent reports from Glassnode show that BTC’s uptrend is not overheated. It used the average entry price for newer investors and its standard deviation bands to arrive at this result. Per this metric, the first level to watch is the +1 deviation around $127k, and the second level to watch is the +2 deviation around $144k.
The data from the platform indicates there is room for more price surges. Bitcoin’s next target is $127k. However, it’s worth noting that the apex coin may grapple with notable selling pressure before it attains the highlighted mark.
Nonetheless, short-term Holders SOPR shows why this group of investors holds the key to a new all-time high. The metric plummeted, hitting neutral as the largest cryptocurrency plummeted. It recovered as some bought the dip. The event suggests that this group is ready to defend price and prevent a drop to $112k, where most bought.
Impending Bearish Crossover
The 1-day chart prints no clear signals of an impending rebound. A breakdown of three indicators shows two completely bearish, while the third shows a tiny glimmer of hope.
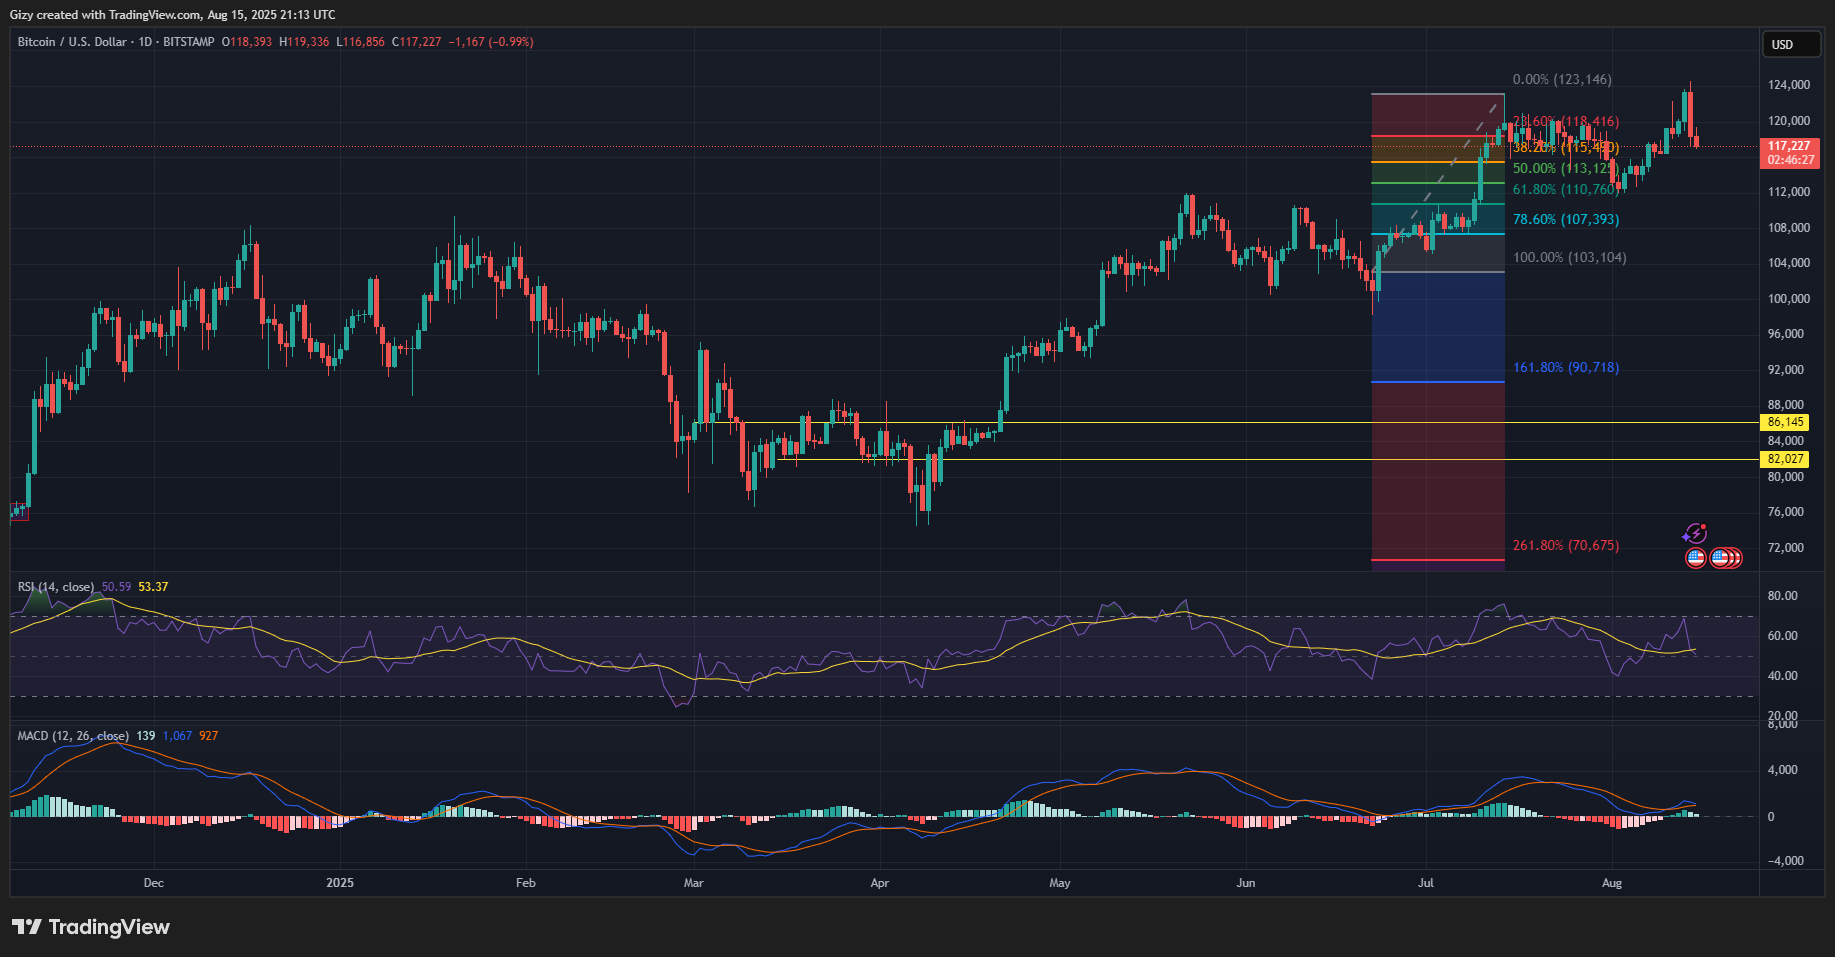
The relative strength index dropped from 68 to 50 in in less than three days. A closer look at its previous movements indicates a high likelihood of a trend reversal. Since April, the metric has rebounded at 50 more than 50 times. A surge may be at hand if a repeat happens.
Conversely, MACD does not support this assertion as its 12-EMA is on the downtrend and edges closer to intercepting the 26-EMA. A bearish crossover signals massive downward momentum. It is worth noting that the last time BTC had bearish divergence, it dropped by over 7% before rebounding.
Aside from the moving average convergence divergence, the bollinger bands show the asset trading above the middle band. It retraced after breaking above the upper band a few days ago. Bitcoin dropped to the lower band the last time this happened. This will result in a drop to $112k.