
Bitcoin traders continue to speculate about the next price. This comes after the asset experienced massive decreases.
The last seven days were riddled with bearish fundamentals. One of the most significant news reports that hit the market was the announcement of a decrease in jobs compared to April. JP Morgan retracted its statement that there would be a possible interest rate cut in July.
The crypto market lost over 5% in 24 hours the day before the FOMC, and the apex struggled with a 3% decline. An analyst called the dump a scam, revealing that this happens every time such a meeting comes up.
He highlighted that this trend played out in the last four meetings. However, a recovery always takes place the next day. The recovery played out as BTC returned to $70k but retraced. Nonetheless, it dropped below $66 for the first time in more than twenty days. Starting Friday at $66,700, it dipped to $64,936.
Following the rebound, traders expected a gradual climb. The current price suggests that this never happened. The apex coin returned to Friday’s low but is trading at its opening price.
The latest flip of the $66k support shows the gradual decrease in demand concentration around the mark. The bulls are dumping this mark for $65k as cryptocurrency rebounded twice around it in the last five days. Aside from its psychological advantage, this is also where the pivot point lies.
Bitcoin Risks Drop to $60k
Following two attempts at flipping the pivot point, $65k is a critical level, and BTC is in a “danger zone.” The trials show increasing pressure on the highlighted mark. Losing it may guarantee a decline to the first pivot support at $58k.
The moving average convergence divergence continues its decline. Since its bearish divergence two weeks ago, it has not printed any new signals. Nonetheless, the 12-day EMA sinks to deeper lows, with the 26-day EMA following.
Nonetheless, the relative strength index hints at a little halt to the massive selling pressure. Still on a downtrend, the metric slowed its descent but remained at 44. Additionally, the accumulation and distribution chart suggests an ongoing buyback attempt. It is seeing slight increases despite the current price turmoil. Prices may follow in the next 24 hours.
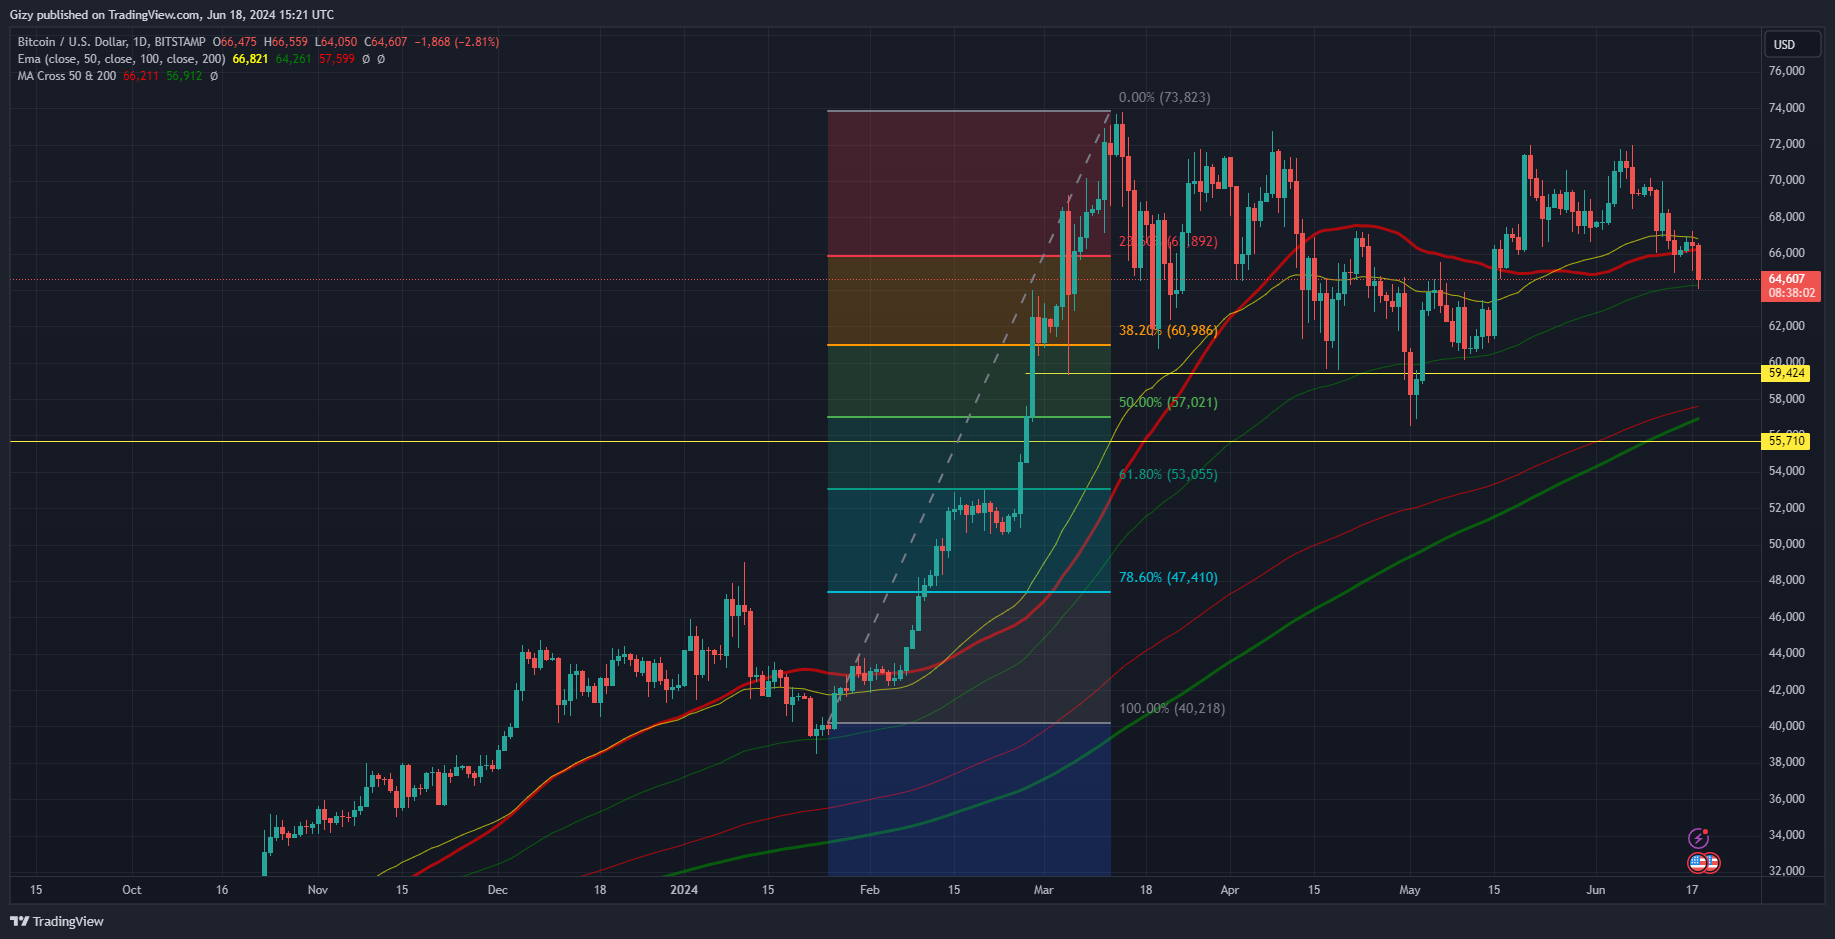
The apex coin has failed to gain stability above it since losing the 50-day exponential moving average four days ago. With the metric at $67k, the asset must flip it decisively to stay clear of $65k. However, it may retest the 100-day EMA at $64k if the decline continues.
Nonetheless, due to the latest price decline, the 50-day moving average resumed its downtrend. The 200-day MA is also approaching its counterpart in an impending death cross. Further decline may hasten the descent and cross
