Bitcoin is having another bad start to the week. Trading action at the time of writing indicates that it retraced to the previous day’s low.
In the early hours of Monday, the apex coin retraced from $113,645 to $111,811 during the first 12 hours of the day. However, the coin saw a slight recovery that sparked hope of a return to its opening price.
The 4-hour shows that the uptick was short-lived as BTC resumed the downtrend in the session starting 16:00 UTC. It retraced from $112,943 and grapples with notable demand concentration at $110,370 at the time of writing.
Nonetheless, the 1-day chart shows that the apex coin dropped to its lowest value since Jul 9. It may be gearing up for further declines, recent reports suggest.
However, traders are seeing massive liquidations in the last 24 hours. Data from Coinglass reveals that they lost over $729 million in the Futures market during this period. Over 80% came from long positions as they accounted for $645 million of the total rekt capital. Nonetheless, liquidation on BTC exceeded $127 million during this period.
It is worth noting that the current sell-offs are a spillover from Sunday. Data from Glassnode indicates that the apex coin saw its largest long liquidation since Dec 2024 as longs worth $150 were wiped out.
Is the Downtrend Ending Soon?
The apex coin retraced further some minutes into writing. It rebounded off $110k and trades slightly higher.
However, reports from Glassnode indicate that losing $110k may result in massive corrections. When Bitcoin was trading at $110,800, it called the mark a crucial support level. It explains that this level is the average cost basis for investors who accumulated between May and June.
It means that a price drop below this level would result in losses for these 1-month to 3-month holders. It may also trigger notable selling from investors who choose to panic sell. Nonetheless, previous price actions showed that when the BTC fails to hold this CB, the market experienced multi-month weakness and deeper price corrections.
What Will Bitcoin Do Next?
A recent analysis pointed to $109k as another cost basis to keep an eye on. A drop to this level is inevitable.
Reports from CryptoQuant affirm this assertion, as it shows several bearish indicators. One such is the exchange reserves. The number of BTC that entered these trading platforms in the last 24 hours exceeded 32k, while outflows were nearly 29.2k. As a result, exchange reserves are increasing.
Nonetheless, the derivatives data show reduced interest in the market as OI notably declines. Additionally, the taker buy-sell ratio is below 1, indicating that the bears are in control and the bulls are paying more to keep their positions open.
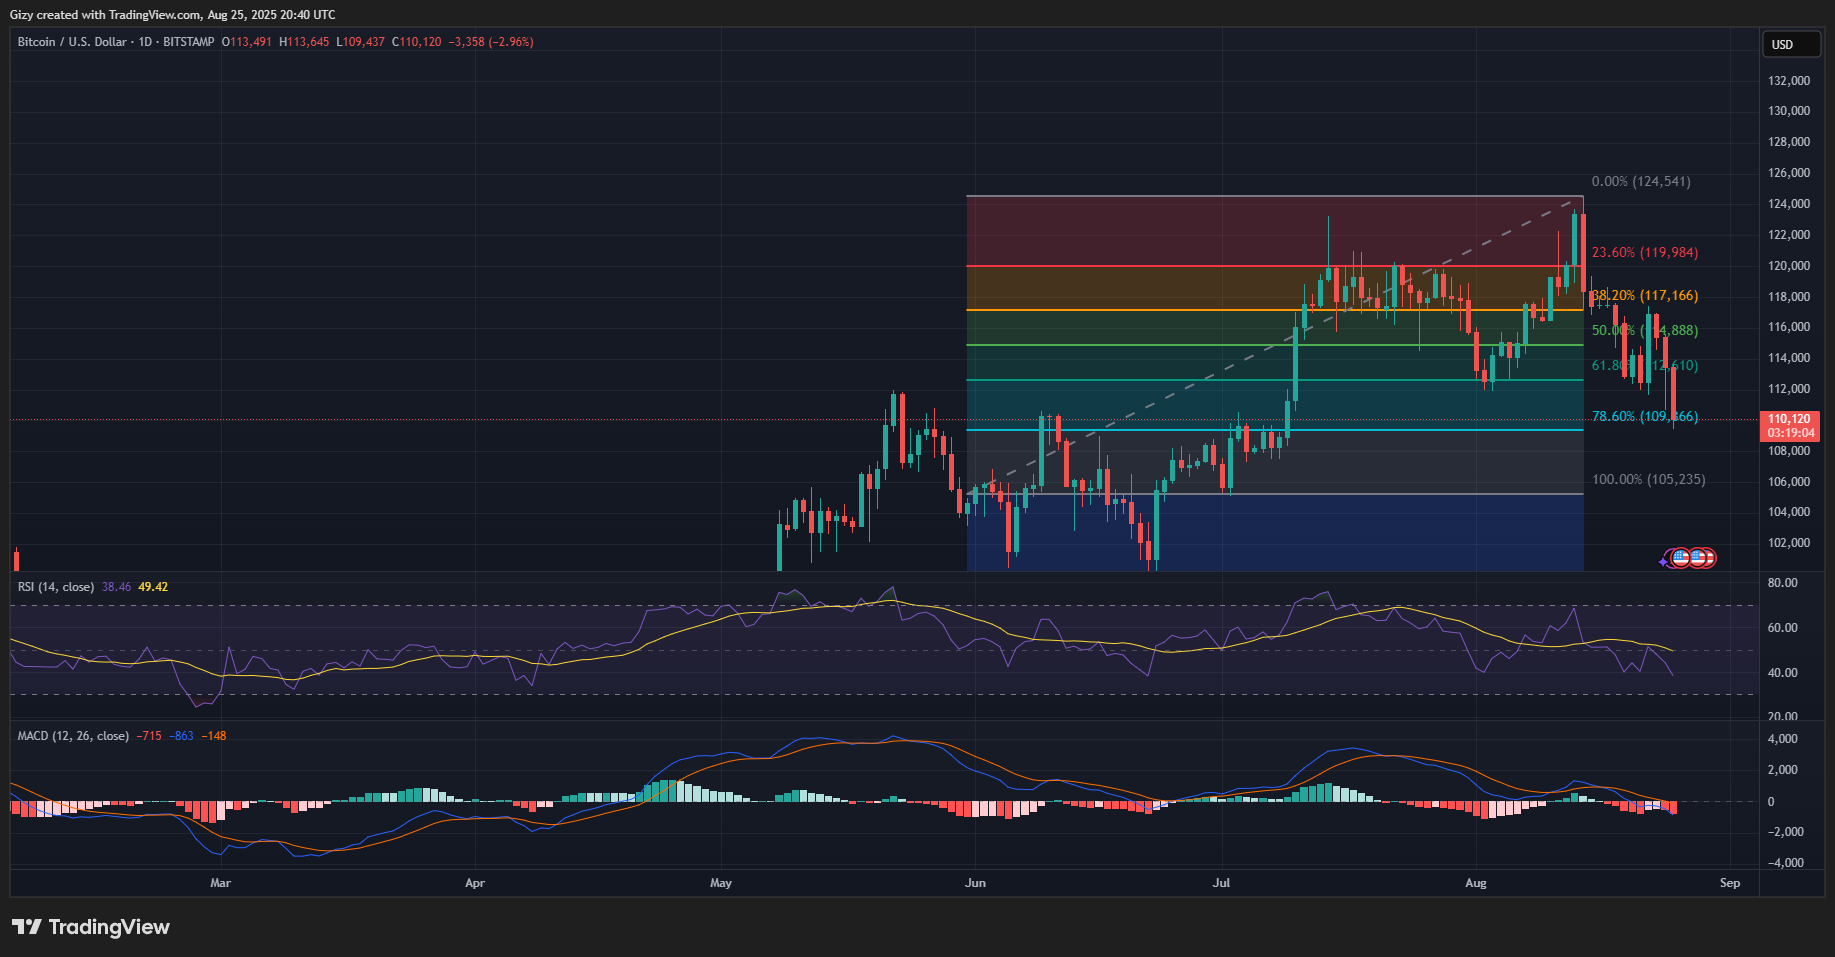
The 1-day chart suggests that the coin will continue its downtrend in the coming days. The Fibonacci retracement levels reveal that Bitcoin is trading at the 78% fib mark. It is important to hold this level as prices will drop to the 100% mark at $105k.
However, previous price movements point to notable demand concentrations at $107k. A closer look at the chart shows how prices hovered around this mark for an extended period before surging. There is a slim chance that history will repeat itself in this case, as other indicators favor further descent.


