ADA is seeing notable increases at the time of writing. It started the day with notable bullish action as the bulls caused a spike in buying pressure.
Other cryptocurrencies also saw a significant increase in the early hours of the current intraday session. However, they failed to sustain the momentum, resulting in price declines.
Nonetheless, the global cryptocurrency market remains steady above $2.35 trillion amidst the downtrend. It briefly exceeded $2.40 trillion during the surge but retraced as trading conditions changed.
The week starts with very little to discuss regarding fundamentals. The bulls may also be getting exhausted following the previous week’s uptrend. How will prices react over the next six days?
Top Four Cryptocurrencies
BTC/USD
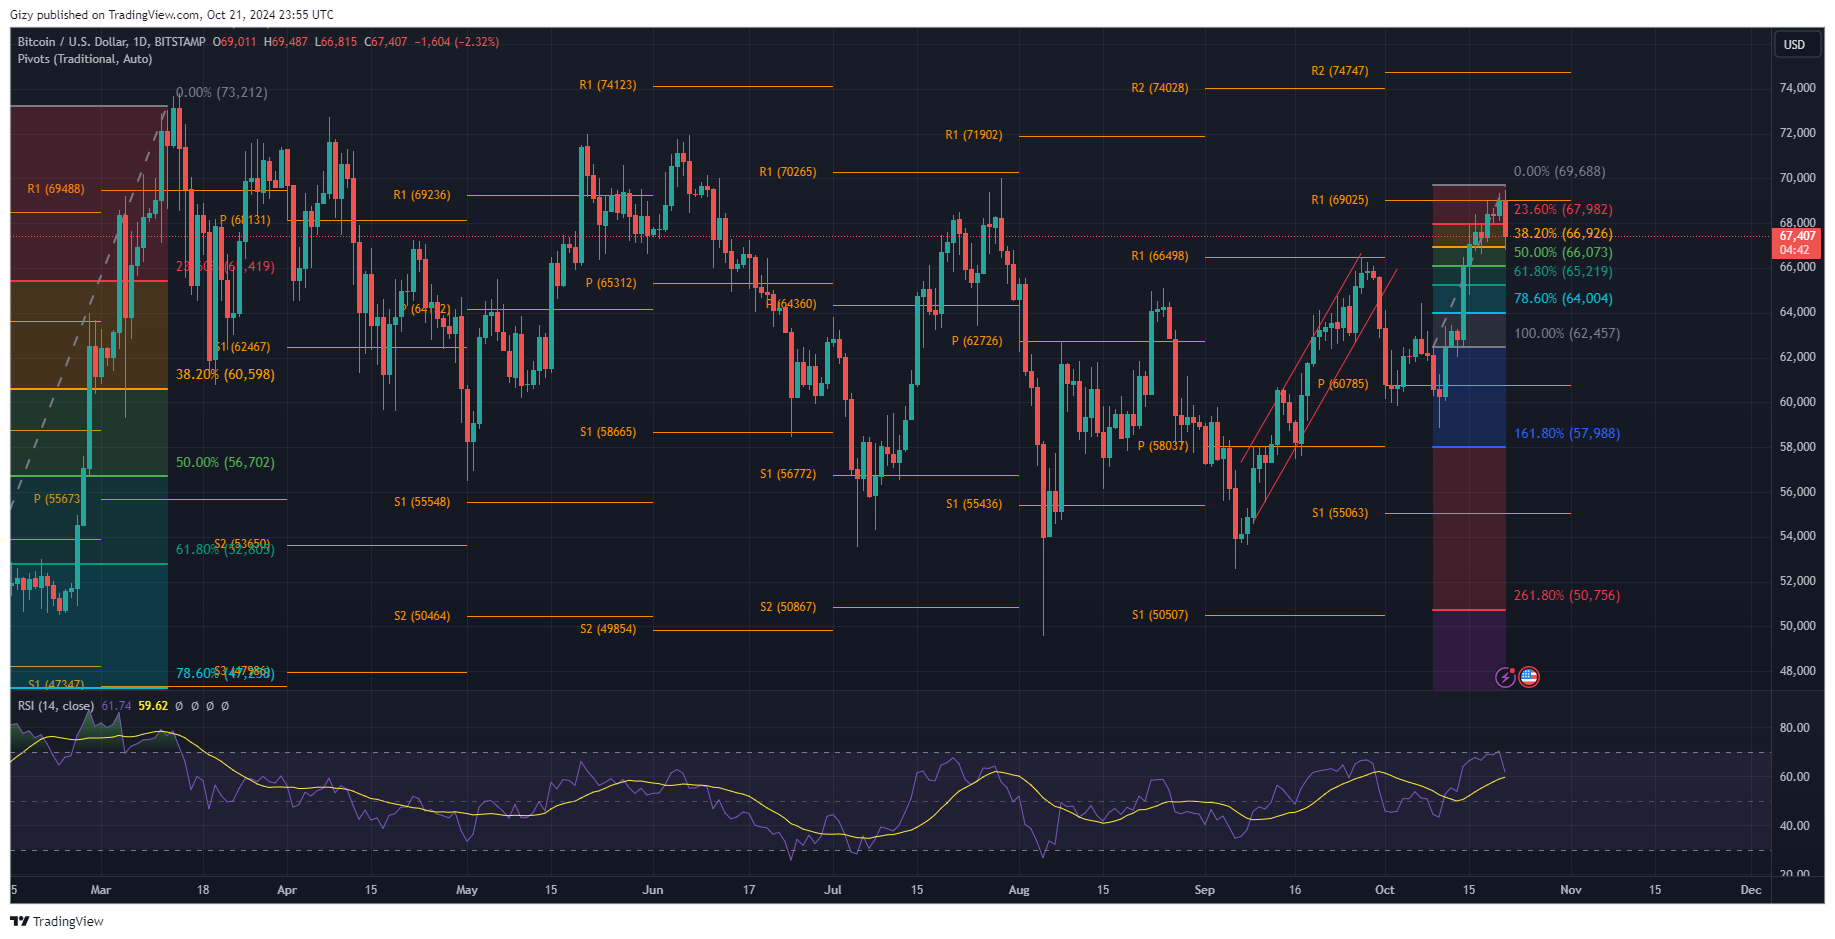
Bitcoin was off to a good start a few hours ago, surged above $69k, breaking the first pivot resistance. However, the surge was short-lived, as it retraced after peaking at $69,487.

The bulls failed to resume the uptrend, breaking the asset below $68k and $67k. Following a small buyback, the downtrend halted at $66,815. However, it has yet to fully recover, down by almost 2%.
While many hope the downtrend is ending, indicators are different. One such is the relative strength index. It trended close to 70 over the last two days and broke above it on October 20. The ongoing downtrend is the result of the BTC being overbought.
Although it is seeing a small buyback, the RSI is at 63, indicating notable selling actions in the last 20 hours. The accumulation and distribution chart also share this sentiment. It is plunging as more traders dump their assets for profit.
Onchain data support this claim as there are many wallets with unrealized profit and may join the selloffs if the downtrend continues. Onchain technicals like the RSI and stochastic are also bearish. RSI indicates that the apex coin is currently overbought and may experience a possible trend reversal.
The Bollinger also hints at a further decline. A few days ago, BTC surged above the upper band and has since hovered above it—the metric points to further corrections.
Bitcoin may sink further over the next six days. The bulls must defend the 38% Fibonacci retracement level at $66,900. Following a slip below the highlighted mark, the cryptocurrency risks a massive decline to the 61% Fib level at $65,219.
SOL/USD
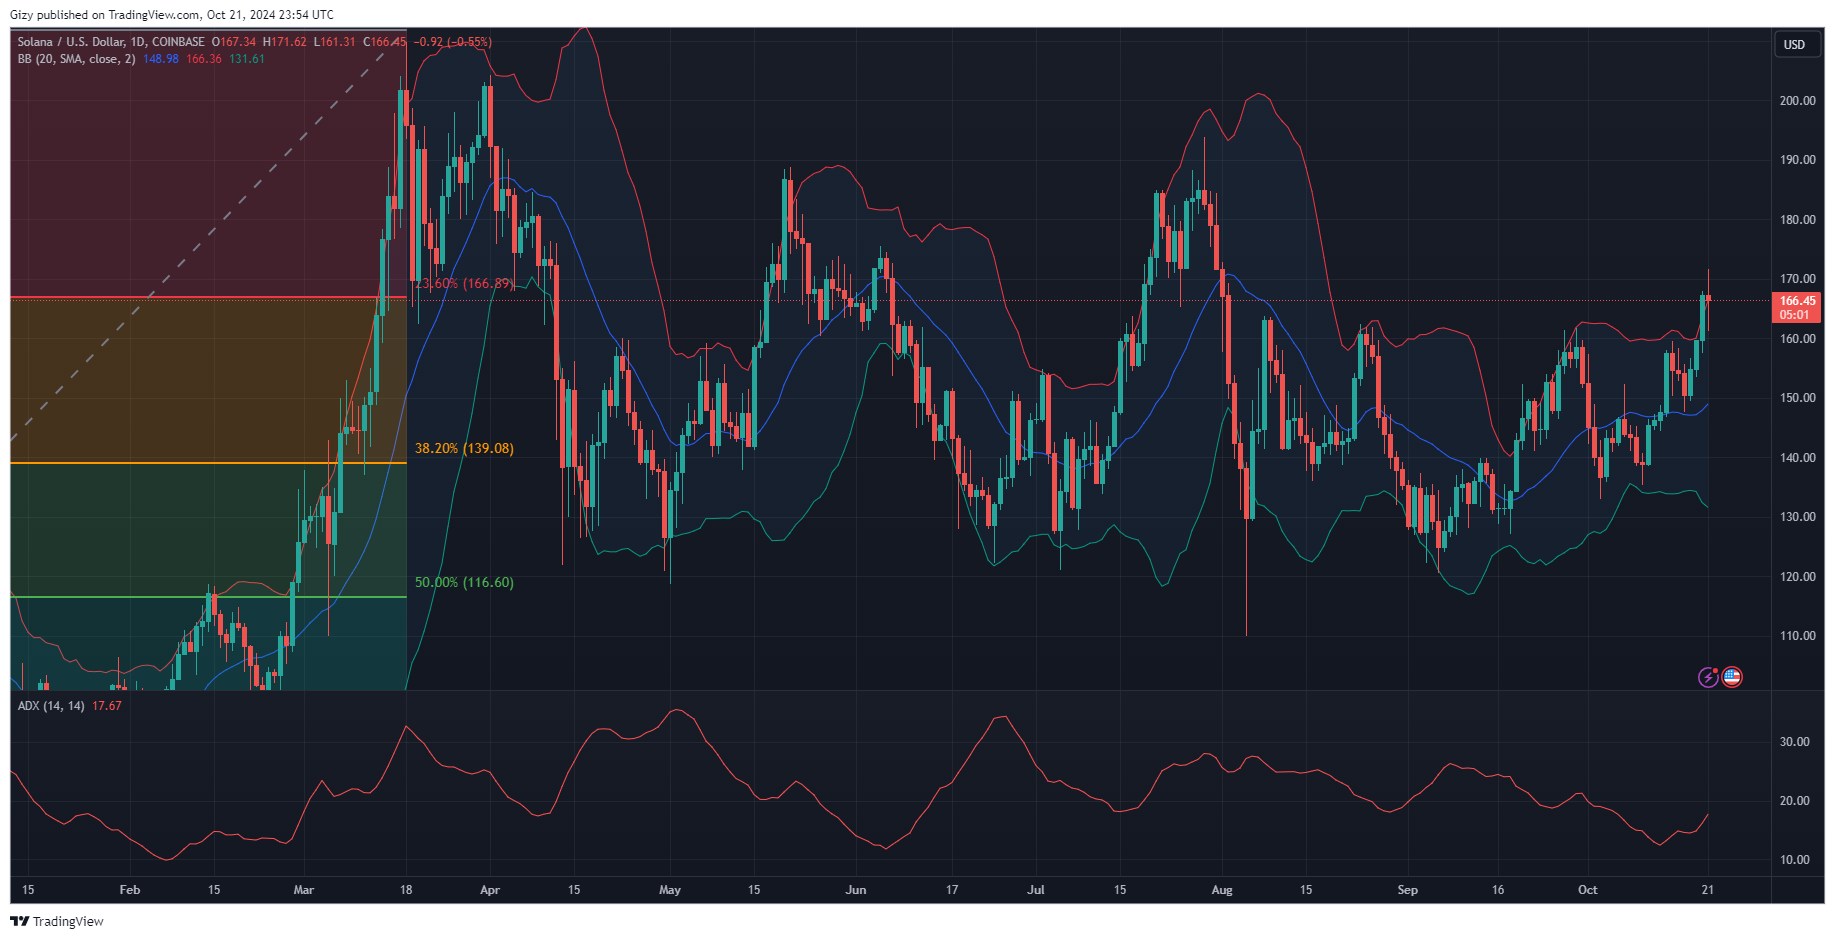
Solana shocked many with its late bullish performance during the previous intraday session. It started at $159 but hovered around this mark for most of the day. The final hours of the session came with a massive increase spike in buying volume. It surged, flipping $160 and continuing upwards. It retested a level post since July and peaked at $167, closing with gains exceeding 4%.
 The early hours of Monday brought more trading volume, with the bulls edging. The spillover from the previous day saw the altcoin continue its climb. It continued upwards, flipping the $170 barrier and peaking at $171. However, it crashed afterward.
SOL saw several selloffs, which resulted in a drop to its peak and further declines, which halted at $161. Following the rebound, it surged, returning to its opening price. Currently printing a doji, fears of further downtrends.
The Bollinger bands show an imminent change in trajectory. The altcoin broke out from the upper SMA during the previous intraday session and closed above it for the first time since July. It continued above it a few hours ago and may close above it amidst the declines. The breakout is a clear sign of an impending trend reversal.
Nonetheless, the relative strength index show room for more uptrend and it is at 66. It also indicates such increase may be shortlived as SOL will become overbought following a spike in buying volume. The average direction index is also on the uptrend as momentum soars.
Following its failure to continue above its first pivot resistance, it lost a critical level. The previous day’s price action points to a notable demand concentration at $160. However, previous price movements hint at a slip to $153.
DOGE/USD
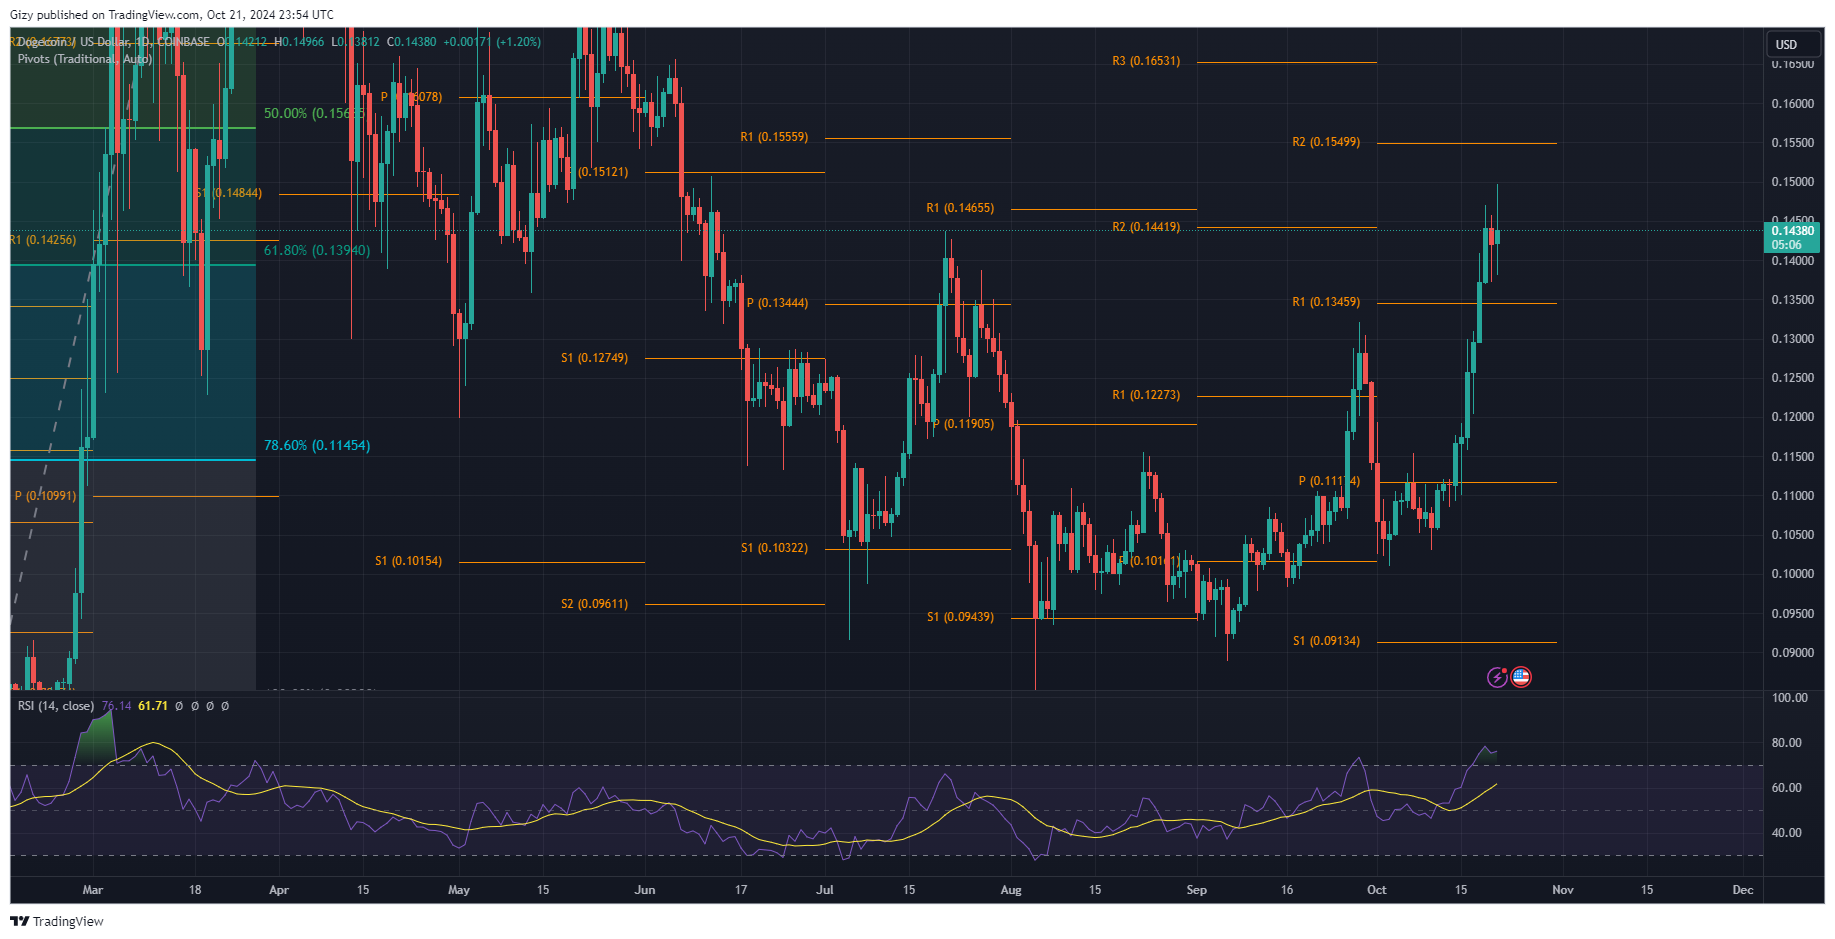
Dogecoin is off to a good start as it flipped another critical level a few hours ago. It started the day trading at $0.142 but surged and retested the $0.15 resistance. However, it failed to decisively break it due to a massive rejection at the mark.

It retraced and broke the $0.140 support but rebounded at $0.138. It is currently trading almost 2% above its opening price, which means the bulls are back in control.
The latest surge was a surprise, as the previous price movement was bearish, and the asset retraced to the current day’s low. Nonetheless, indicators are blaring warnings. One such is the relative strength index. It broke above 70 three days ago following the surge above $0.13. It became overbought and is seeing the same trend as its 76.
It remains to be seen if the bulls will continue pushing prices up. If this happens, the altcoin may surge above $0.15. However, there is a huge risk of massive declines. It may retrace as low as $0.13. Previous price movement points to a possible drop to $0.118.
ADA/USD
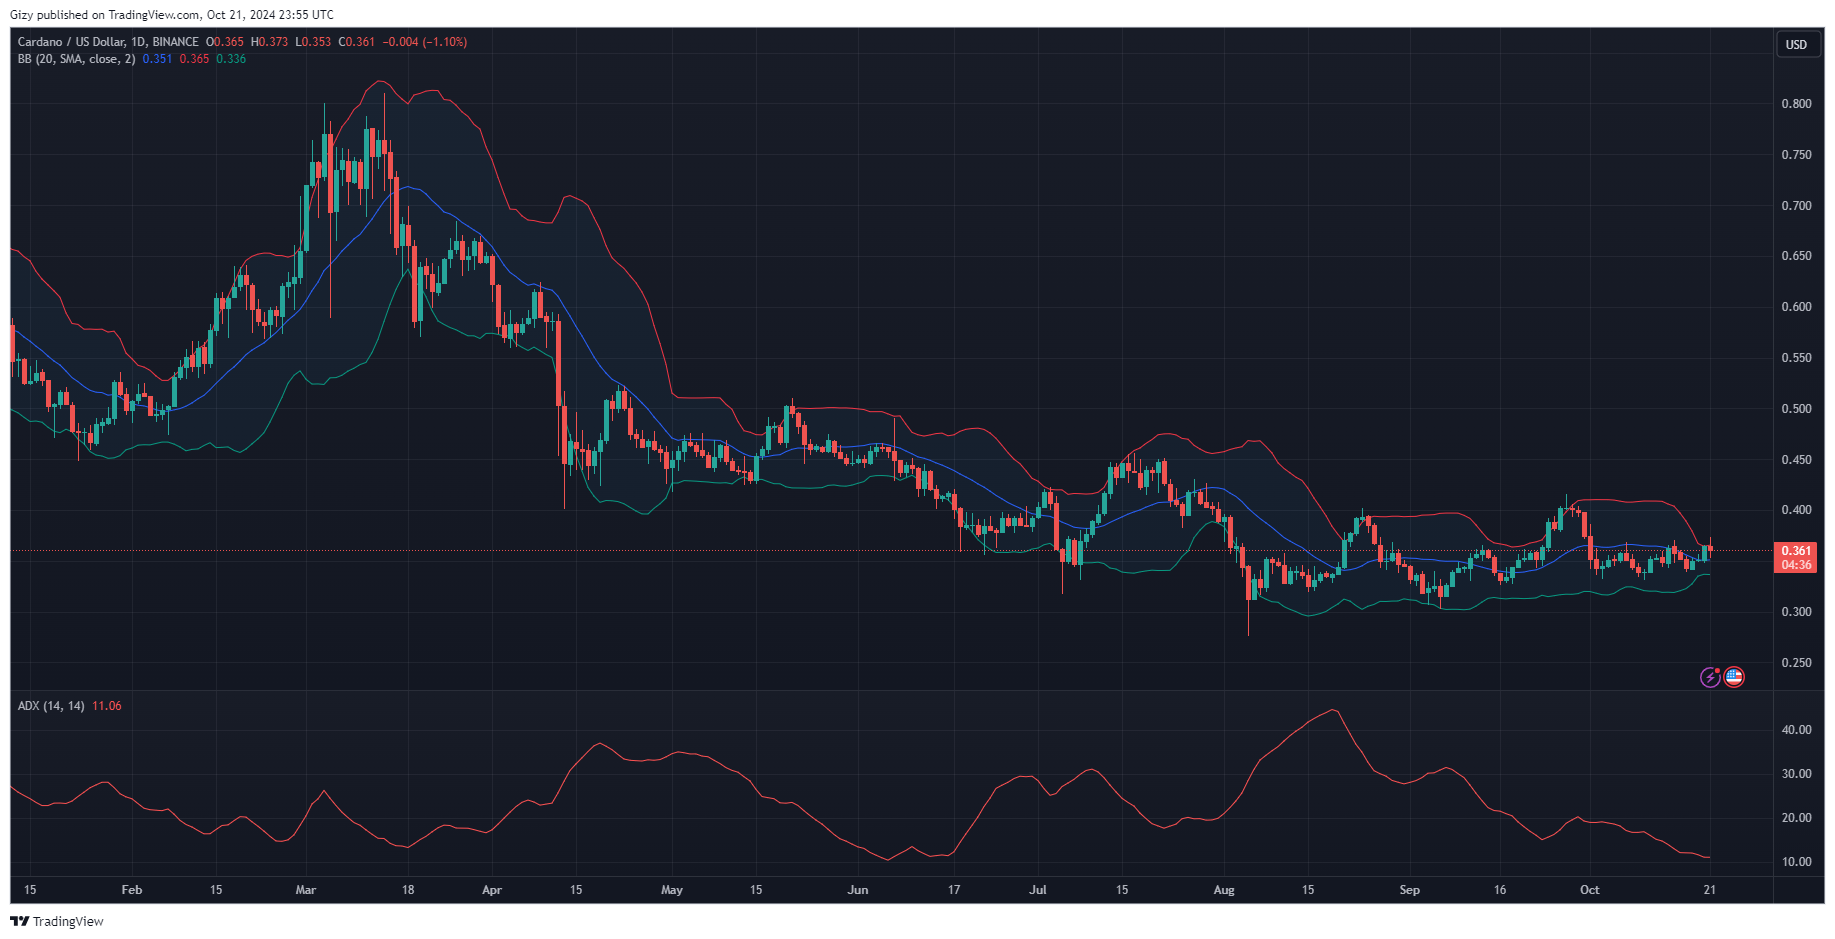
Cardano was off to a good start during the current intraday session. It opened with a notable bullish push and surged to a high of $0.37 after starting at $0.36. However, the bulls failed to sustain the uptrend, resulting in a massive decline to $0.35. Currently trading at $0.36, the altcoin is back above its opening price.

The earlier push was a spillover from the previous day’s bullish sentiment, which saw the coin close with a gain of 4%. It is showing notable signs of further decline and may drop lower in the coming days.
Nonetheless, MACD showed a bullish divergence a few days ago. On the other hand, ADA is losing momentum, and the ADX is declining in response. It is at risk of dropping as low as $0.34 in the coming day.
