
SOL may close the last three days of the week with green candles. Currently in its second, the altcoin will look to continue its uptrend.
The global cryptocurrency market cap is rising, returning to $2.20 trillion. It registered significant increases in the last 24 hours as valuations increased by over 5% and trading volume slightly increased.
Traders are slowly regaining their confidence in the market as the fear and greed index is on the rise. Although small, this change is worth noting, as the sector saw massive losses at the start of the week.
Institutions have resumed buying, with Blackrock adding over $700 million of Bitcoin to its portfolio. ETF buyers added more, as the US BTC exchange-traded fund saw inflows exceeding $300 million.
Several assets in the top 10 saw notable volatility over the last five days. Let’s examine how they performed.
BTC/USD
Bitcoin was off to a bad start on Monday, registering small losses. Nonetheless, it started the day at $62k but experienced notable increases in its buying pressure, and prices shot up. It peaked at $64,444 but retraced as closed with minimal losses.
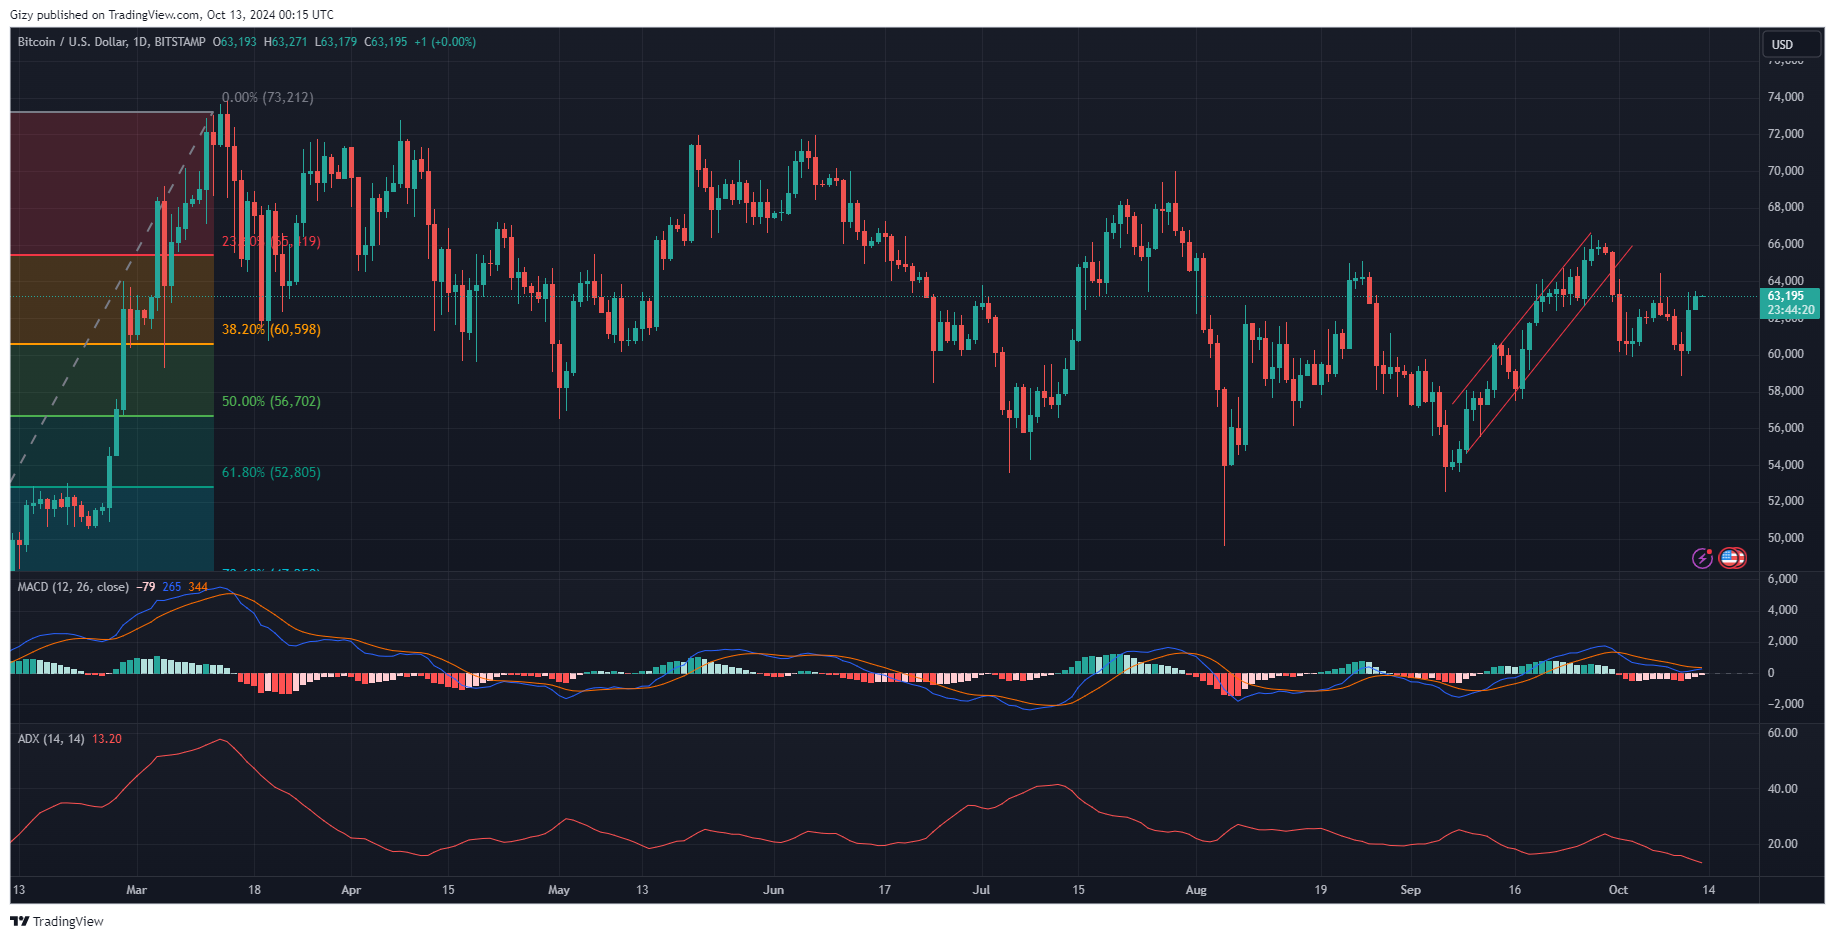
A similar price action happened the next day. However, it ended with a doji. BTC failed to recover on Wednesday as it saw its most significant dip. It started trading at $62k but dropped due to a massive increase in selling pressure. The apex coin lost the $62k support and tested the $60k barrier but rebounded.
The third of the week ended with losses exceeding 2%, and the downtrend worsened on Thursday. Bitcoin lost the $60,000 barrier, slipping as low as $58k before rebounding. Nonetheless, it recovered and closed at its opening price.
The coin’s price action over the last 48 hours shows that the bulls have seized the initiative and are staging several buybacks. Currently edging closer to $64k, indicators are flipping positive. One such indicator is the momentum indicator, which is rising in response to the latest bullish actions.
The same movement is also present in the relative strength index. It is at 55 from 43 two days ago, indicating a significant change in market sentiment. The moving average convergence divergence is also printing bullish signals at the time of writing.
MACD’s 12-day EMA has halted its decline and is heading upwards in a bullish convergence. If the current trading conditions continue, it will intercept the 26-day EMA in the coming days. However, the average direction index has yet to respond to the latest shift in price trajectory.
ETH/USD
Ethereum was off to a good start on Monday. It experienced a significant increase in buying volume, resulting in a short burst. However, the surge was shortlived, as the asset faced strong rejections at $2,520. It retraced and closed below its opening price.
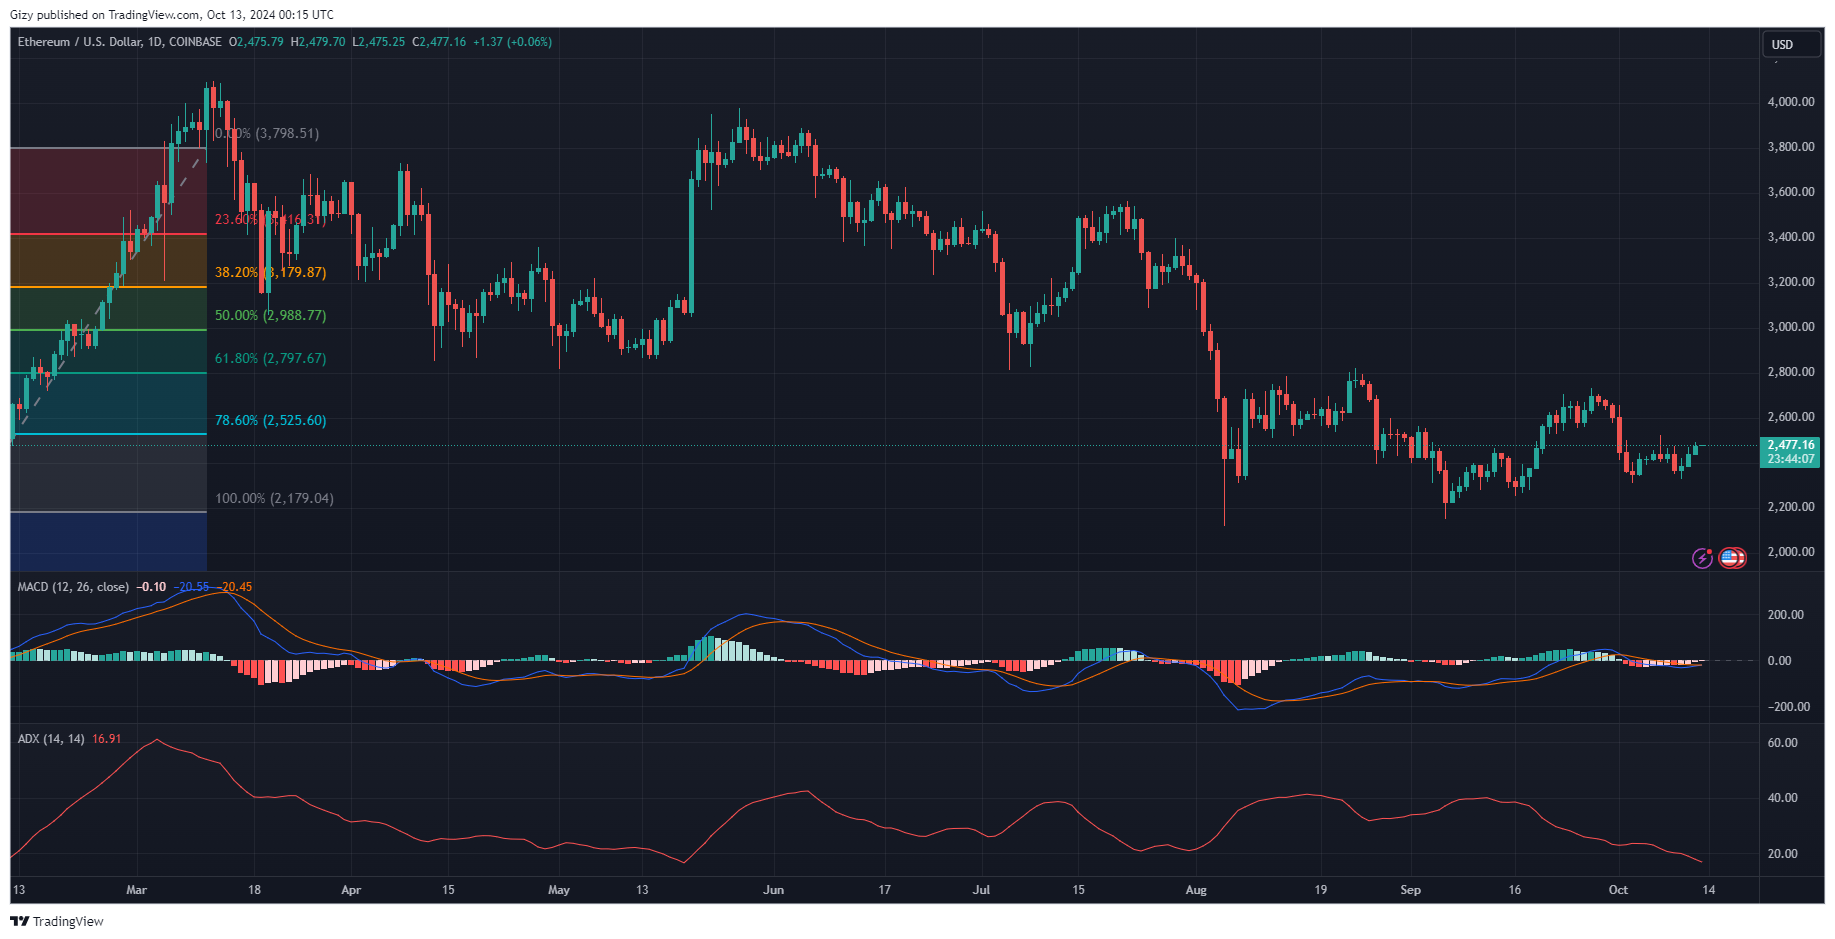
The bulls attempted a buyback the next day but had limited success as the coin barely moved. Nonetheless, they lost complete control on Wednesday as the coin registered its most significant drop of the week. It dropped after a failed trial at $2,500, hitting a low of $2,349. Although it saw a slight recovery, it closed with losses of almost 3%.
ETH tested the $2,300 support the next day but rebounded off it and briefly reclaimed $2,400. However, it closed with a doji. Nonetheless, the uptrend continued the next day as it peaked at $2,471, gaining over 2%. Currently edging closer to $2,500, some indicators are bullish.
The moving average convergence divergence is also printing bullish signals at the time of writing. MACD’s 12-day EMA has halted its decline and is heading upwards in a bullish convergence. If the current trading conditions continue, it will intercept the 26-day EMA in the coming days. However, the ADX has yet to respond to the latest shift in price trajectory.
The RSI is also positive as it’s rising. It is at 50 from 4o a few days ago. The asset is also gradually gaining momentum as the metric is on the rise.
BNB/USD
On the weekly scale, Binance coin has yet to register any significant change in price since the start of the week. The candle representing price actions shows a long wick sticking below, indicating that the coin is recovering from a notable dip.
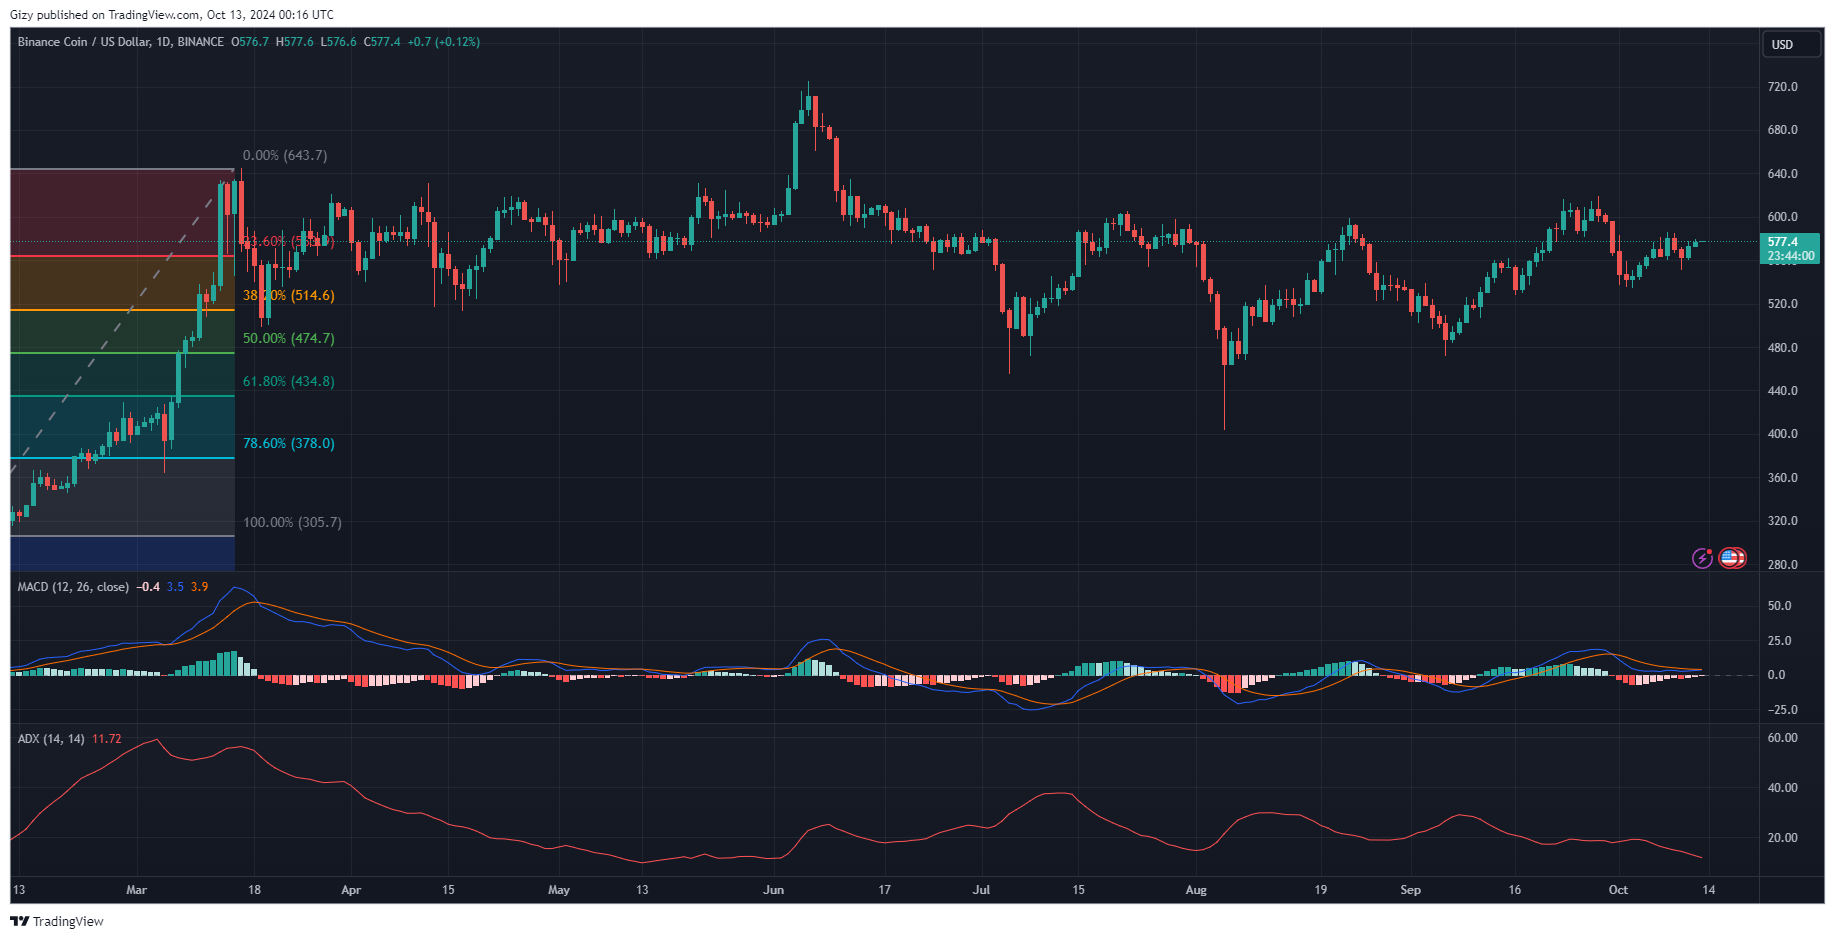
Following a small hike above $580, BNB retraced on Monday and closed with small losses. The bulls staged buybacks the next day, resulting in notable increases. It surged from $560 and broke $580, peaking at $586. The day closed with gains of almost 3%.
The altcoin saw a notable price decline over the next two days. On Wednesday, it lost more than half of its previously accumulated gains and retraced to its lowest on Thursday. It dropped as low as $551 before rebounding.
The bulls have again reclaimed dominance, and prices reacted positively over the last 48 hours, with BNB registering notable increases. Indicators are also responding to the latest shift in price trajectory.
The momentum indicator is rising in response to the latest bullish actions. The same movement is also present in the relative strength index. It is at 52 from 49 two days ago, indicating a significant change in market sentiment. The moving average convergence divergence is also printing bullish signals at the time of writing.
MACD’s 12-day EMA has halted its decline and is heading upwards in a bullish convergence. If the current trading conditions continue, it will intercept the 26-day EMA in the coming days. However, the average direction index has yet to respond to the latest shift in price trajectory.
SOL/USD
Solana was mainly bearish for the first four days of the week, seeing significant losses. Nonetheless, it looked promising at the start of the session, with a short burst on Monday. The bulls caused a surge above $150, hitting a high of $152, but they faced massive rejection, resulting in a close below its opening price.
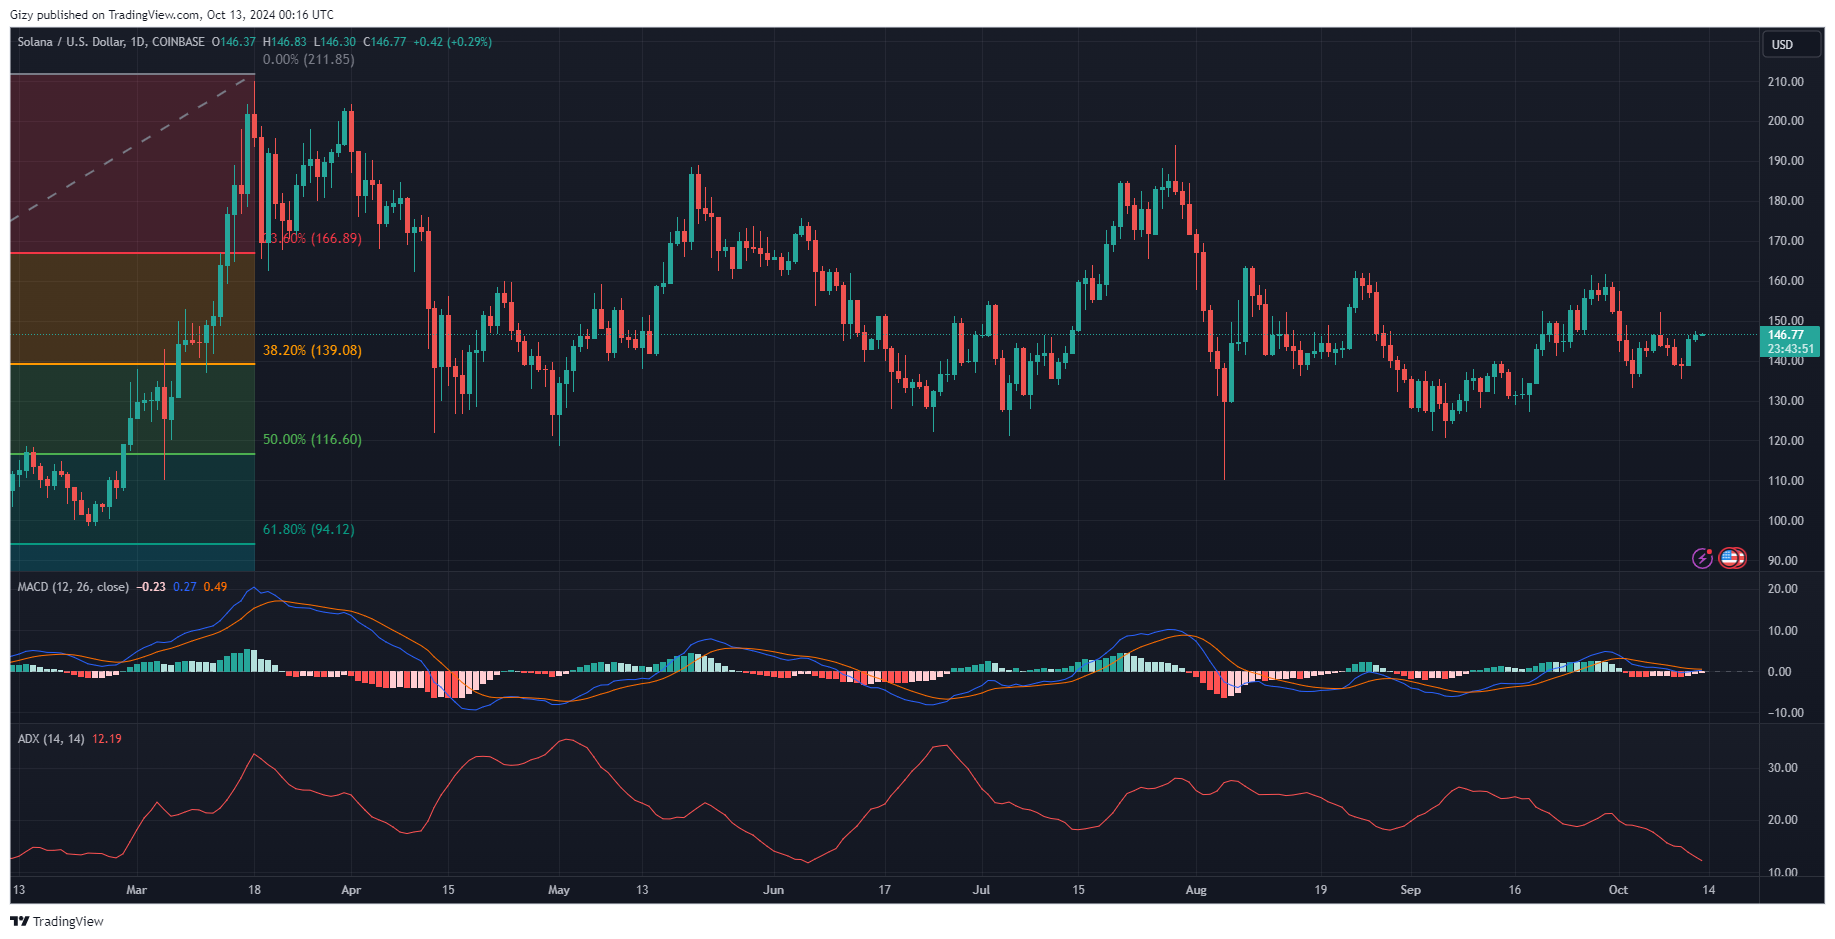
Nonetheless, it’s on the rise and has gained significant value in the last two days. It surged by almost 5% during the previous intraday session. Indicators are also flipping positive.
One such indicator is the momentum indicator, which is rising in response to the latest bullish actions.
The same movement is also present in the relative strength index. It is at 53 from 43 two days ago, indicating a significant change in market sentiment. The moving average convergence divergence is also printing bullish signals at the time of writing.
MACD’s 12-day EMA has halted its decline and is heading upwards in a bullish convergence. If the current trading conditions continue, it will intercept the 26-day EMA in the coming days. However, the average direction index has yet to respond to the latest shift in price trajectory.
