
Bitcoin showed notable potential for recovery on October 10, as it peaked at $61,200. Traders expected it to flip $62k, but it stopped and retraced.
Several bullish fundamentals made the rounds. One such was the release of the Consumer Price Index. The expectation was 3.30%, but it came out lower at 3.2%. The upbeat readings also showed US inflation slowing down. It dropped to its lowest in the last three years.
The S&P 500 saw a significant uptrend in response to the news. However, Bitcoin retraced instead. Surprisingly, the price correlation between both assets failed to affect the cryptocurrency after the stock surged.
Why is Bitcoin Down?
Earlier this week, a court upheld a previous ruling from 2022, allowing the US government to auction over 69,000 BTC, valued at approximately $4.4bn at current prices. Fears of the government selling off the asset looms, and the market may react to it.
However, others contend that the selling has begun as they expressed shock over the coin’s inability to surge. They asserted that the US is selling off the cryptocurrency but is implementing Germany’s style of not openly revealing its actions. However, no on-chain data backs up this claim.
In both speculations, selling pressure was responsible for the most recent decline. On-chain data also suggests that this may be the case, as several regions are bearish. For example, traders in Asia are skeptical about the next price action and are selling off their holdings as a result. The Korea premium is negative, backing up this claim. The US also sees the same sentiment, as the Coinbase premium is negative, and miners are still selling.
Data from SoSoValue points to a significant outflow from ETFs as the culprit for the latest decline. ETFs registered outflow exceeding $40 million in the last 24 hours.
RSI Hits New Low
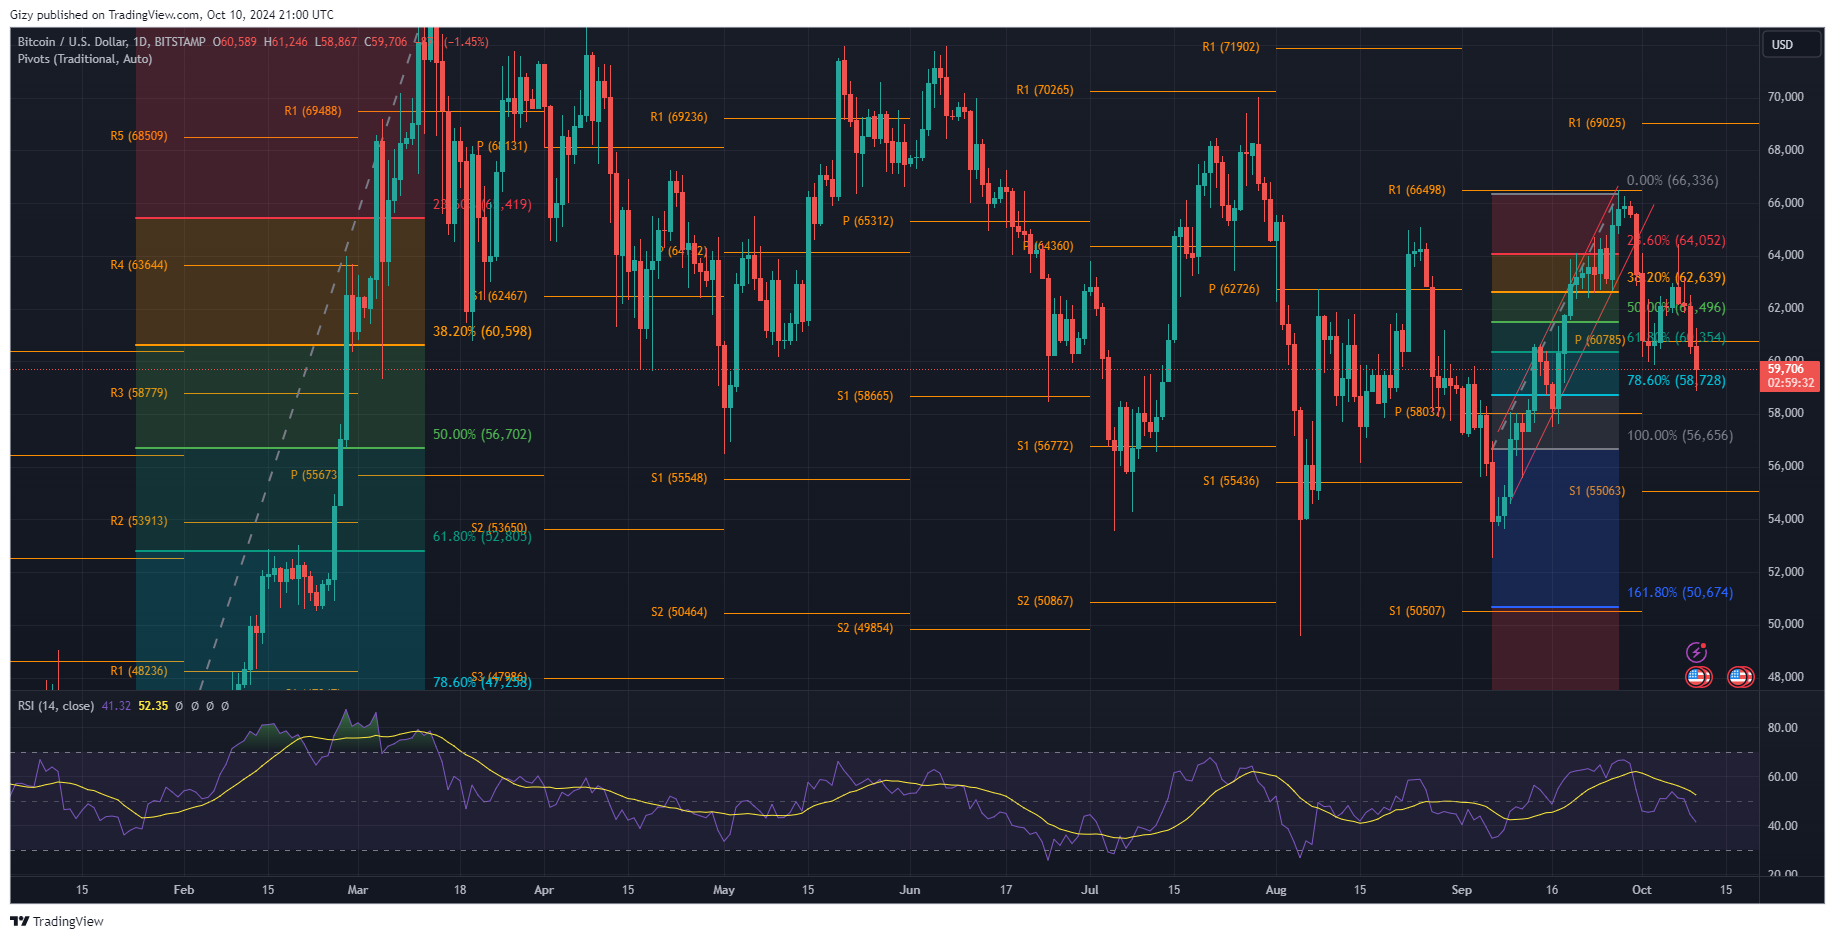
Chart indicators are reacting to the latest price drop. One such is the relative strength index. It dropped from 50 on Tuesday to 41 (the lowest since early September) at the time of writing. The notable decline is in reaction to the growing selling pressure. The same movement is also in the momentum indicator as it plummets in response to the current downtrend.
The moving average convergence divergence continues its decline. The 12-day and 26-day EMA are also hitting new lows and show no signs of an impending trend reversal. Bitcoin also dropped below the 200-day exponential moving average.
However, on-chain RSI hints at an impending surge. The metric is positive, which means BTC is oversold, and a trend reversal is imminent. The latest reading comes amidst dwindling exchange reserves. The data also shows that long-term holders are holding on to their assets. Additionally, the exchange netflow total is negative due to less inflow into trading platforms.
The derivative market is seeing more funding amidst the current price drop. Traders lost over $64 million in the last 24 hours trading bitcoin, with most of the liquidations coming off long positions. The bulls are funding their existing positions to prevent liquidation. Affirming this claim is the fact that open interest is lower than the previous day while the funding rate increased.
A trend reversal may be imminent as several indicators are tilting towards it. Other data points to notable asking orders at $61k. Following its rebound at $58,800, the bulls continue buying back, and the apex coin is closer to reclaiming $60k. This means it will likely test $61k after a surge above the barrier.
However, the bulls must defend the $60k support, as another slip to $58k may result in further decline. The Fibonacci retracement level points to the 100% level at $56k, which is the next mark the apex coin may test.
