
Bitcoin just crossed $66k for the first time since July. It started the day at $65,171 but hovered around the opening price with a slight decline. Nonetheless, the milestone happened a few minutes before the time of writing.
The most recent attainment has divided the market about where the apex coin will go. Some speculate it is due for correction, while others contend it will continue the uptrend. The cause of the bullish actions remains shrouded in excitement. Nonetheless, several factors contributed to the hikes.
Improved World Economy
Recall that a previous analysis stated that Bitcoin would continue to decline as the world’s economy worsens and added that the ETF made the asset more susceptible to factors affecting traditional stocks. The current price reflects what that piece talked about.
The Chinese central bank announced interest rate cuts earlier this week, barely a week after the US announced a similar action. Both news significantly impacted the crypto market, with Bitcoin having a fair share.
These events resulted in positive changes in traders’ psychology as many became bullish. A clear indication of this is on-chain data. The US market is pumping more funds into the apex coin. Coinbase premium is currently positive in reaction to this trend. ETFs are also seeing significant inflow, with funding exceeding $365 million in the last 24 hours.
Exchange reserves are also on the decline as more BTC leave them. Traders are taking their assets off these platforms and storing them in cold storage, a very bullish sign. The constant outflow resulted in the exchange netflow becoming negative.
Derivatives are also seeing notable funding, with many long-position traders adding to their positions. There is also colossal buying sentiment in the market as more buy orders are getting filled. Over 10 million short positions were liquidated in the last 24 hours.
Nonetheless, the bulls are gradually soaking up the supply. This comes as the miners continue selling moderately.
All the bullish on-chain data shows that the asset may continue the surge. However, what is the chart saying?
Bitcoin is Overbought
The on-chain relative strength index suggests that the apex coin is overbought—the metric hints at an impending downtrend or trend reversal. The one-day chart also shows the on-chart RSI edging close to 70. Currently at 66, it will reach the boundary in the next 24 hours if the uptrend continues.
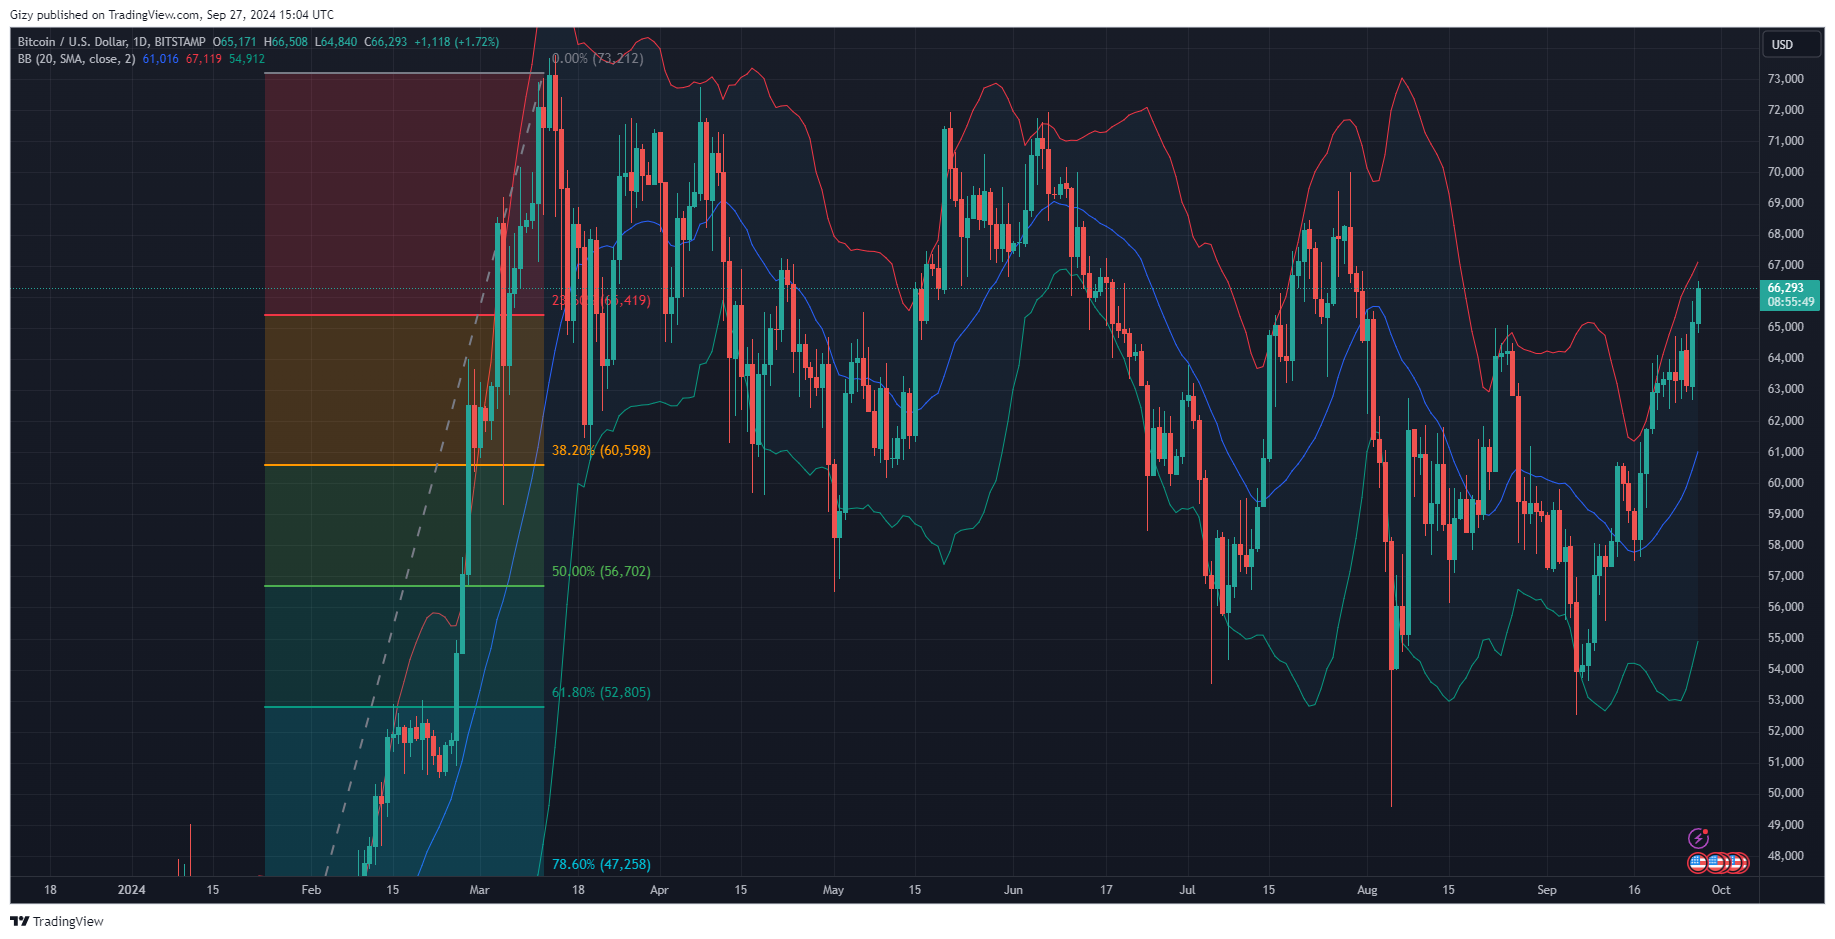
The asset also retraced after testing its first pivot resistance at $66,500. It faced massive rejections, resulting in correction. Nonetheless, Bitcoin may retrace to $64,000 in the event of a selloff. The previous price suggests notable demand concentration around it. Some traders are also placing buy orders around this mark as some lose faith in the uptrend.
The high number of unrealized profits heightens the fear of a massive price decline. It means traders may start taking profit. A slip to $62k is almost inevitable if this plays out, and $60k may be in sight.
On the other hand, the push to $70k may continue. Data from Coinglass shows more traders placing sell orders around this mark. Indicators also point to the possibility of the asset hitting the mark. One such is the Bollinger Bands. BTC is exchanging between the upper and middle bands and has not exceeded these bounds.
The average direction index also shows a notable push towards this price mark. The momentum is still rising. It is also worth noting that the $66,500 level may serve as support for the bulls. Previous price movement suggests that a flip of the $70,000 resistance is almost inevitable.
