
Bitcoin continues to experience stiff resistance at $64k. After several attempts, it has been unable to break this critical level for the third day.
Nonetheless, it briefly peaked at $64,121 during the previous intraday. It started trading at $62,950 but saw a slight upward push. It failed to maintain trading above it and retraced to its opening price.
The constant failure to break above the mark is causing fears of a possible retracement, which would see the asset lose all the gains it’s accumulated.
Rising Bearish Trends
On-chain data shows growing signs of bearish actions. For example, exchange reserves are on the rise as traders look to take profit, selling off their assets. Nonetheless, the exchange netflow total is negative, which may indicate an impending end to the selloffs.
Funds inflow from the Asian market remains negative, as the Korean premium shows no inflow. ETFs and other products tied to bitcoin are also seeing minimal buying pressure with significant outflows.
Nonetheless, the on-chain RSI is negative, indicating that the apex coin is overbought and due for corrections. It is also the same trend as stochastic, as both point to an impending trend reversal. On the other hand, the miners are not responsible for the latest price trend as they continue to sell moderately.
The derivatives show more answers as they see more actions. Funding rates increased by a small margin over the last 24 hours. In addition to the open interest, more traders are losing their short positions due to small bursts in prices. The market is largely bearish amidst the liquidations.
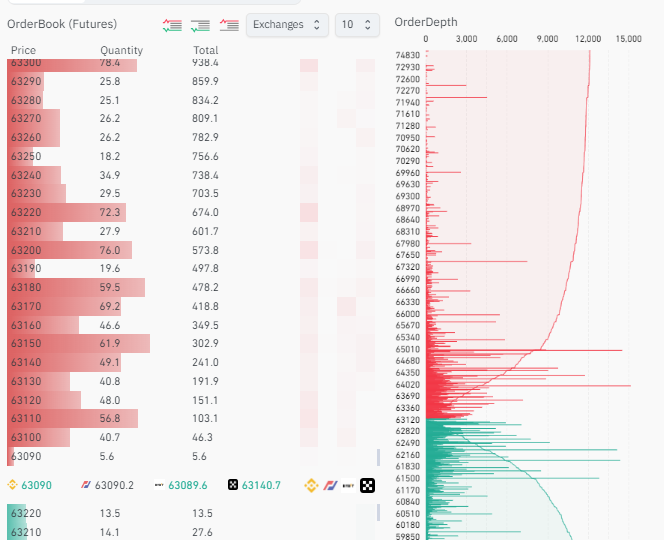
Nonetheless, long positions are increasing as many anticipate an impending breakout. Due to this belief, others are placing sell orders higher than the current price. For example, the chart above shows significant sell orders between $64k and $65k.
The orders could indicate a possible accumulation and an impending flip of this crucial level. In case of a trend reversal, the $62k support looks robust as there are significant buy orders, attesting to the notable demand concentration around it.
Bitcoin Uptrend is Losing Strength
Aside from the obvious indication on the one-day chart, indicators are pointing to a possible end of the uptrend. One such indicator is the average direction index, which measures the strength of a trend. It is trending almost in a straight line, indicating that the upward drive is slowly dying.
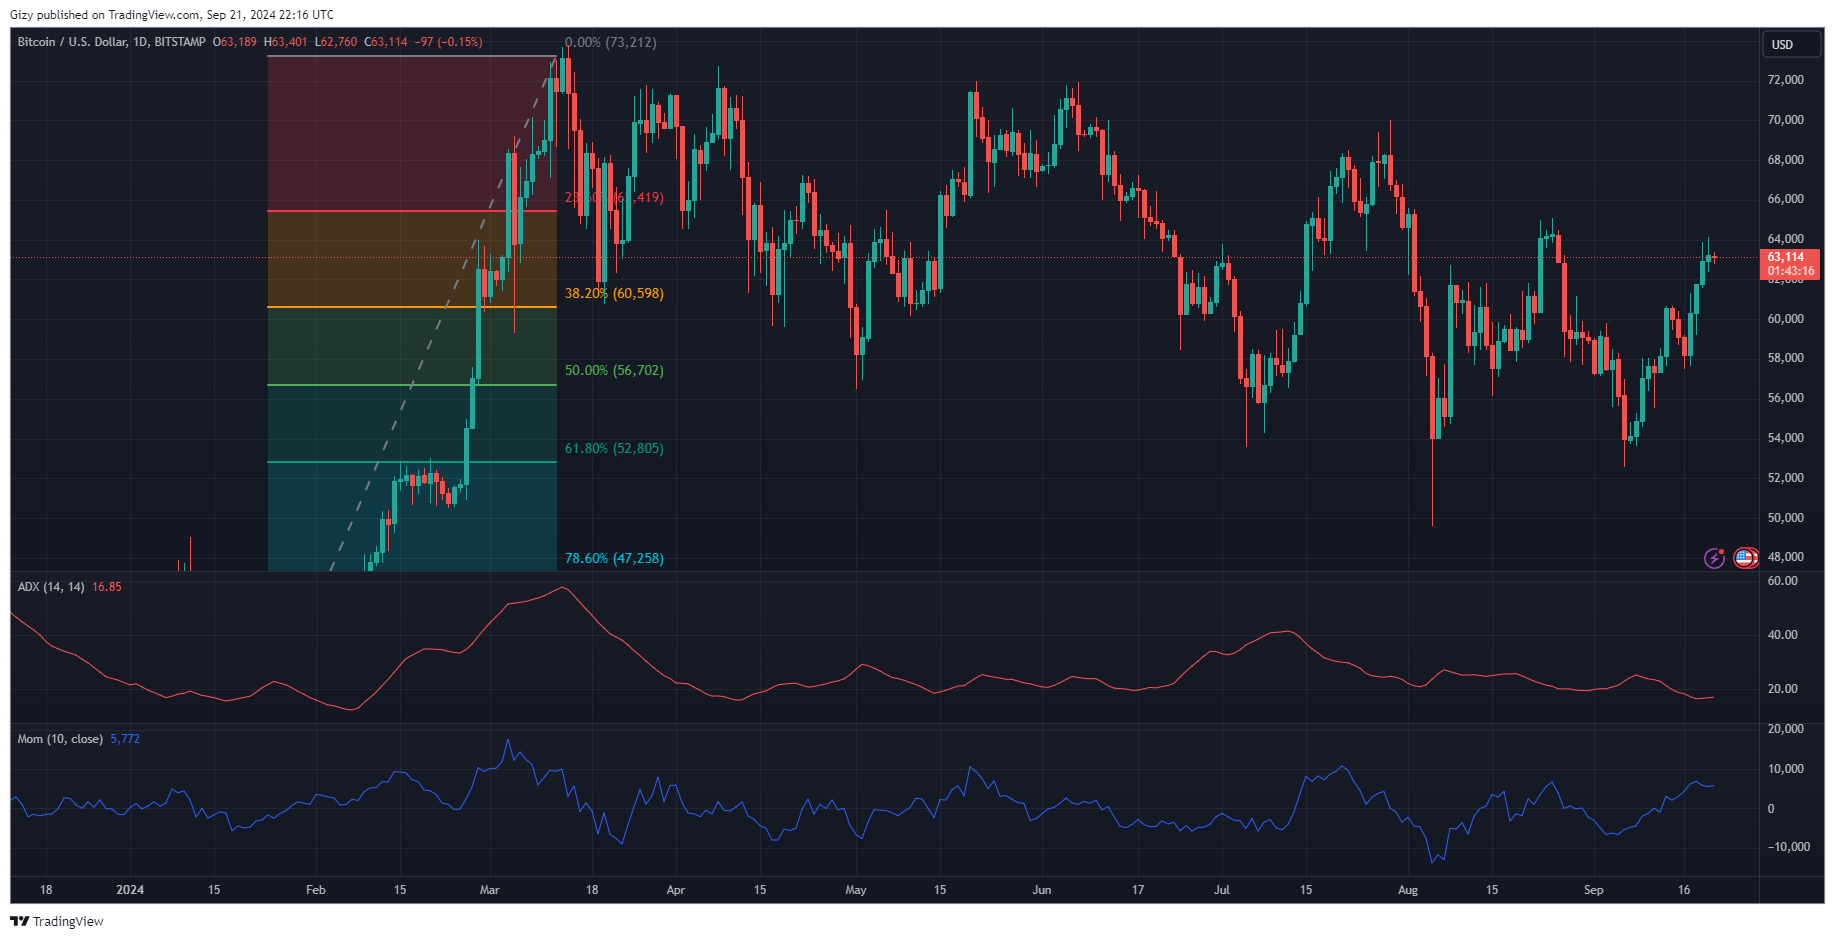
The momentum indicator is seeing similar movement, as the apex coin may soon retrace as it succumbs to bearish pressure. Adding to the worries is the Bollinger bands. BTC briefly surged above them twice in the last three days. Seen as a sign to exit a trend, it heralds the start of a downtrend.
Nonetheless, the moving average convergence divergence maintains its bullish stance amidst growing concerns. Both EMAs are still on the rise, hitting levels they’ve not attained since August. However, the peak may also point to an impending trend reveal as previously happened. RSI shines no ray of hope as it is stagnant, indicating the gradual drop in buying pressure.
Bitcoin is likely to crash in the coming days as all indicators hint at it. However, the orders placed around $64k and $65 may result in either of these scenarios playing out: The apex coin hit both price targets and retraced to $62k, or it fails to hit them and retest $62k, flipping it.
The pivot point standard points to a possible flip of $66k barrier as this is the first pivot resistance. In either case, a trend reversal is inevitable. Nonetheless, the Fibonacci retracement point to the fact prices may linger around $65k as this is the 23% Fib level.
