HNT is among the top gainers behind SATS. It registered notable increases in the last 24 hours as it broke several resistances. ORDI is closely following behind, with gains of over 13%.
The crypto market started the day a little slow as most assets in the top 10 grappled with significant selling pressure. Trading conditions have since improved, leading to an almost 2% increase in the global cryptocurrency market cap.
Following the small boost, traders’ sentiment has significantly improved. The fear and greed index dropped to 34 last week but is at 54 at the time of writing.
With the small improvement in the trading conditions and traders’ psychology, the crypt market may be gearing up a significant move this week.
Top Five Cryptocurrencies
BTC/USD
Bitcoin saw huge volatility during the previous intraweek session. It retraced to its lowest since February, flipping the $50k support. The candle representing the week’s trading actions points to the asset recovering and attempting to reclaim lost levels.
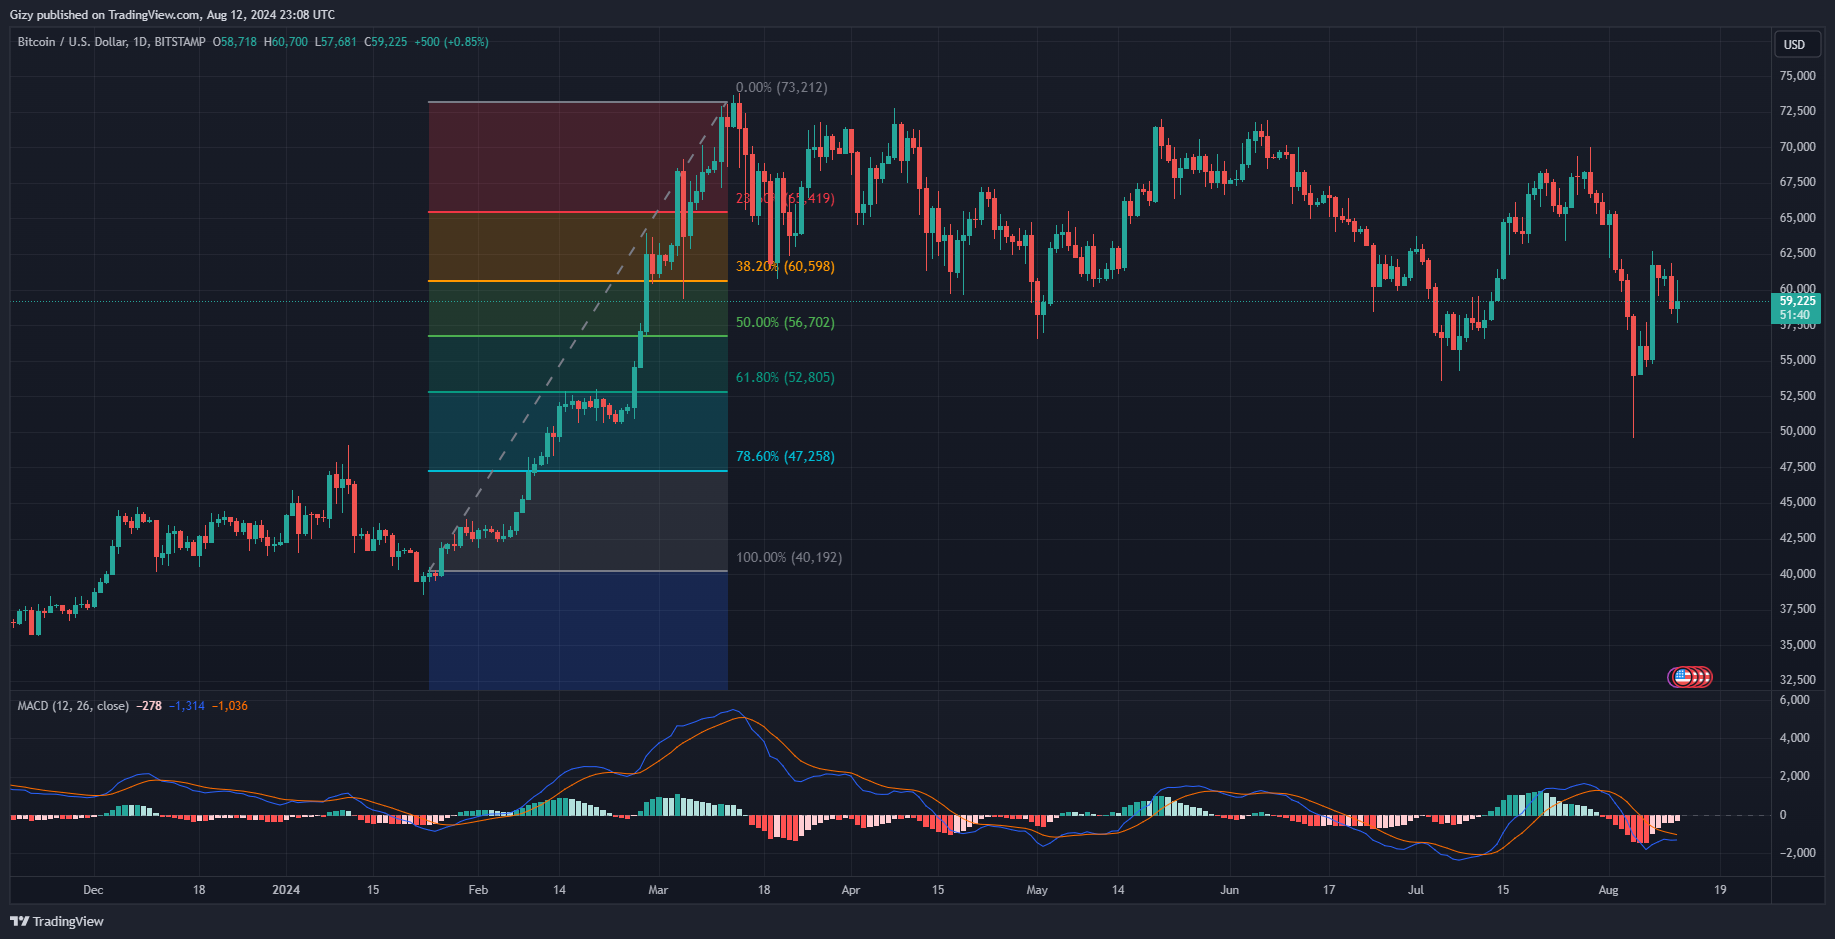
It surged to a high of $62,729 but failed to continue as it hit a brick and returned to its opening price. This also explains the doji. The same candle is playing out this week as the apex coin grapples with huge uncertainty in price.
It started the day at $58,718 but retraced to a low of $57,681. It rebounded and peaked above $60k but is struggling at $59k.
Indicators are becoming increasingly silent in response to the most recent uncertainty in price. MACD was once printing buy signals as the 12-day EMA halted its downtrend and started surging. However, trading actions in the last three days contribute to the metric trending parallel.
RSI is also on the decline as the buying pressure decreases. With the ongoing trend, the week’s action is looking bleak. Nonetheless, the asset is still exchanging above the second pivot support.
The bulls must resume buyback or risk further drop. The Fibonacci retracement suggests that the buyers may get a chance to halt the downtrend at the 50% Fib level. It means that the apex coin may break below $57k and $56k in the coming days.
Nonetheless, BTC may retest $62,500 if trading conditions improve.
SOL/USD
Solana is seeing notable price changes with huge volatility. However, the bulk of the moves were downward, dashing previous bullish speculations.
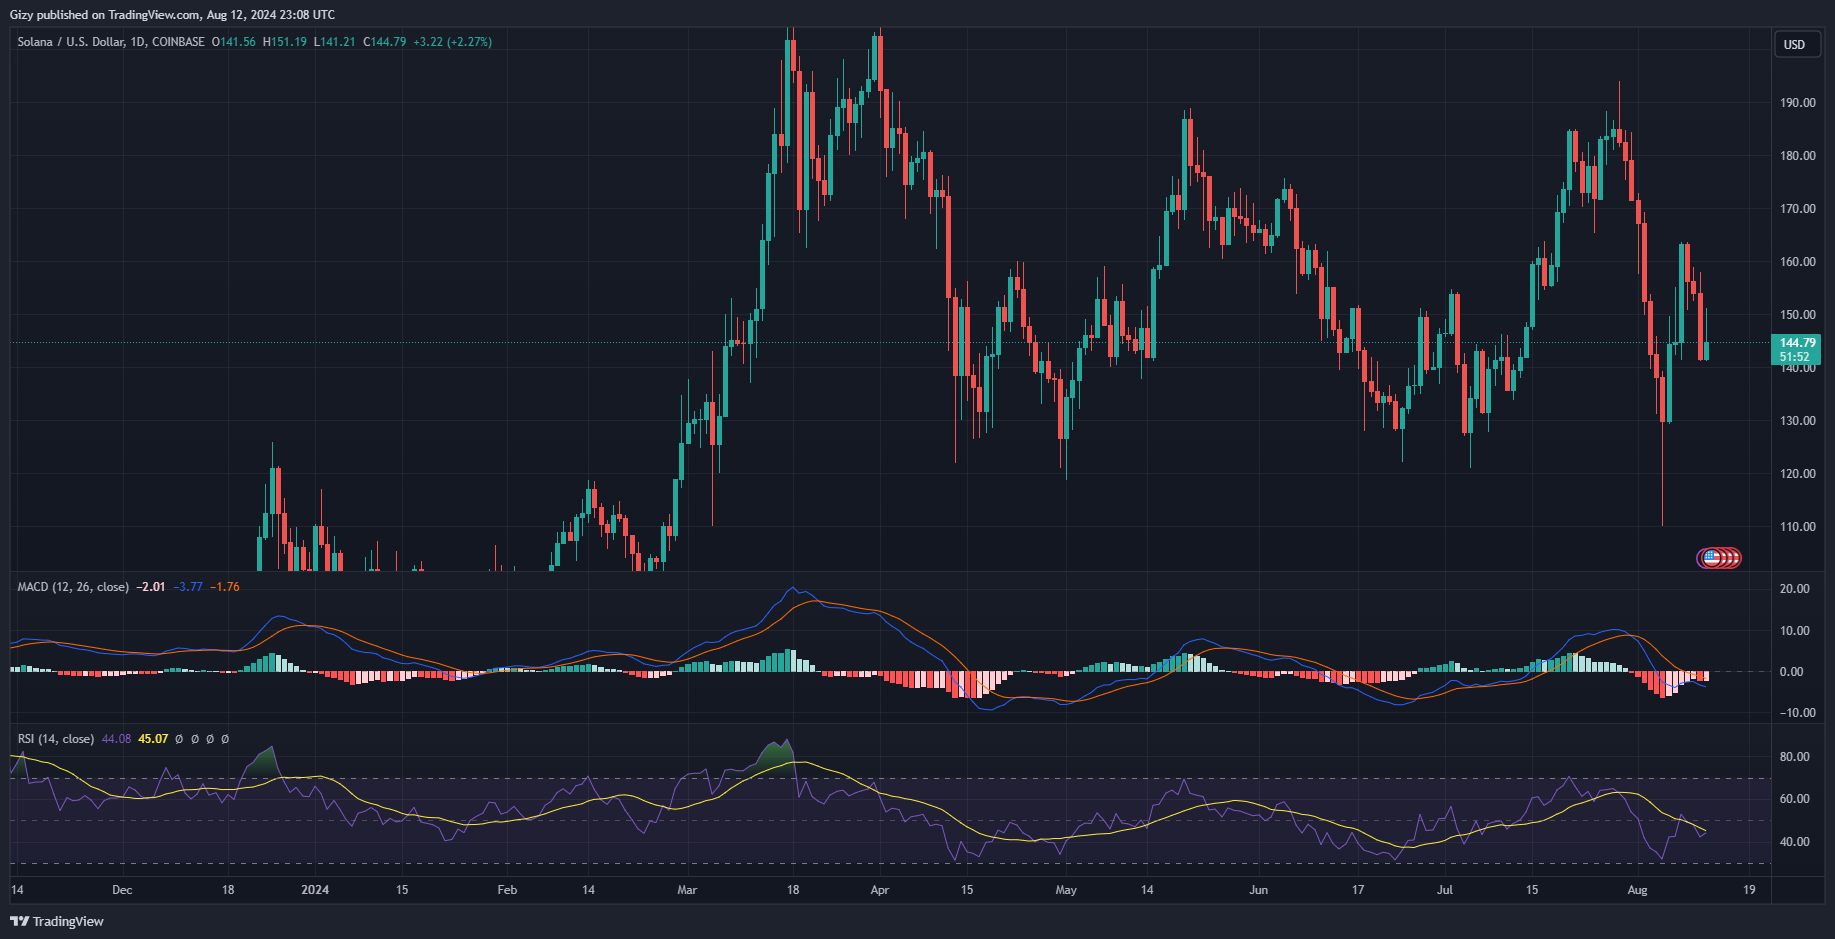
The last three days were some of the most bearish as the coin lost over 14%. It dropped from $163 on Friday to $141 on Sunday. The dip affected indicators like the moving average convergence as it altered its previous positive outlook.
The relative strength index also registered notable trajectory change. It indicated that the fourth-largest cryptocurrency saw massive bearish action as the metric dropped from 53 on Friday to 42 on Sunday.
Solana is seeing notable buying pressure at the time of writing. However, it appears traders are taking profit as it retraced from $151 to $143. Nonetheless, RSI is improving due to a small increase in buying volume.
If such increases in buys continue, SOL may reclaim $150. While MACD is silent, previous price movements suggests that the $140 support may hold up this week. The mark has seen several test and rebounds.
The closest such event was on Wednesday and Thursday, when it rebounded twice off the highlighted mark. However, failure to resume the uptrend may see the altcoin dip as low as $130.
DOGE/USD
At the time of writing, Dogecoin is seeing a notable buyback. The coin continues its attempt at recovery with limited success.
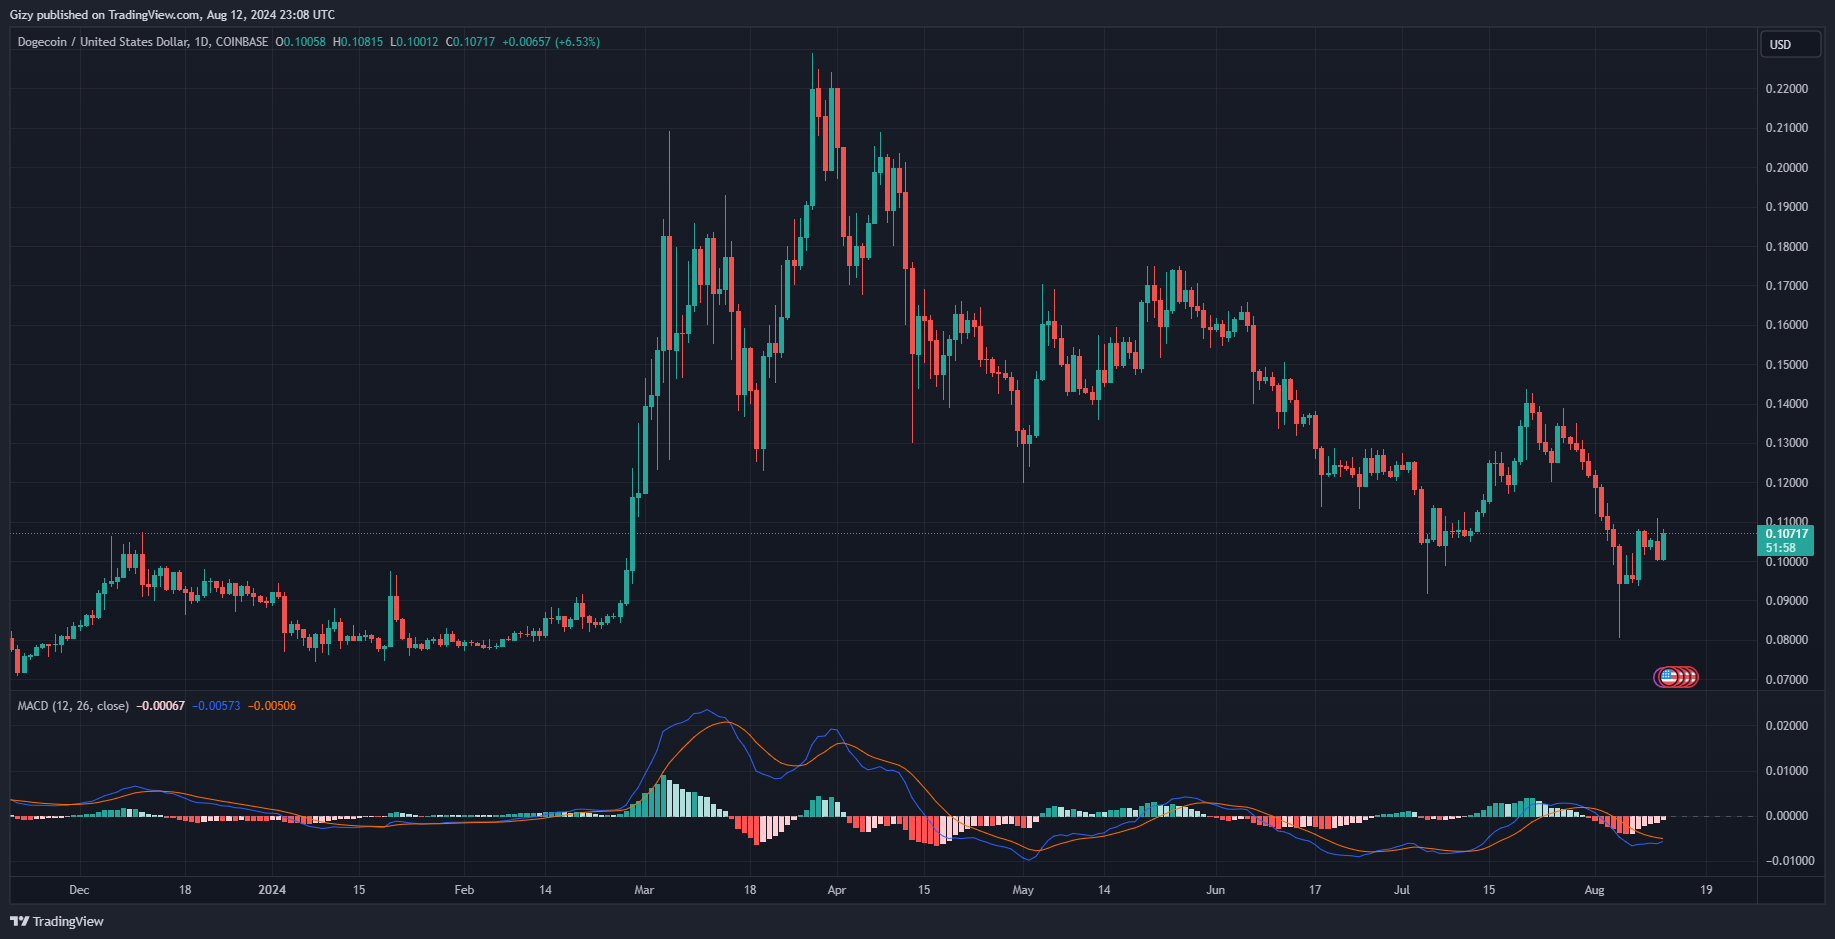
Nonetheless, the memecoin was one of the worst hit by the downtrend. DOGE’s decline started in the last few days of July and extended to August 5. It lost over 30% during this drop and has barely recovered 10% of these losses.
The Dogecoin community is silent on the most recent trend, which may indicate a possible price trend with a horizontal channel where it bounces between a particular support and resistance.
Nonetheless, the moving average convergence divergence is printing buy signal. The 12-day EMA is on the uptrend and may intercept the 26-day EMA within the next 48 hours if trading conditions remain the same.
It also means that the coin may continue it uphill movement, building on the current 5% gain. It will climb above $0.11 within the next 24 hours. The bulls may hold the support throughout the week and attempt $0.12.
On the other hand, DOGE is at risk of further decline. It bounced off $0.10 in the last four days. The trend may continue, and it could retrace further if the bulls fail to defend this critical mark.
SUI/USD
SUI climbed as trading volume exploded. It started trading at $0.87 but surge as it saw massive bullish actions. Trading volume increased by over 170% in the last 24 hours. Prices are also improving as the asset peaked at $1.12.
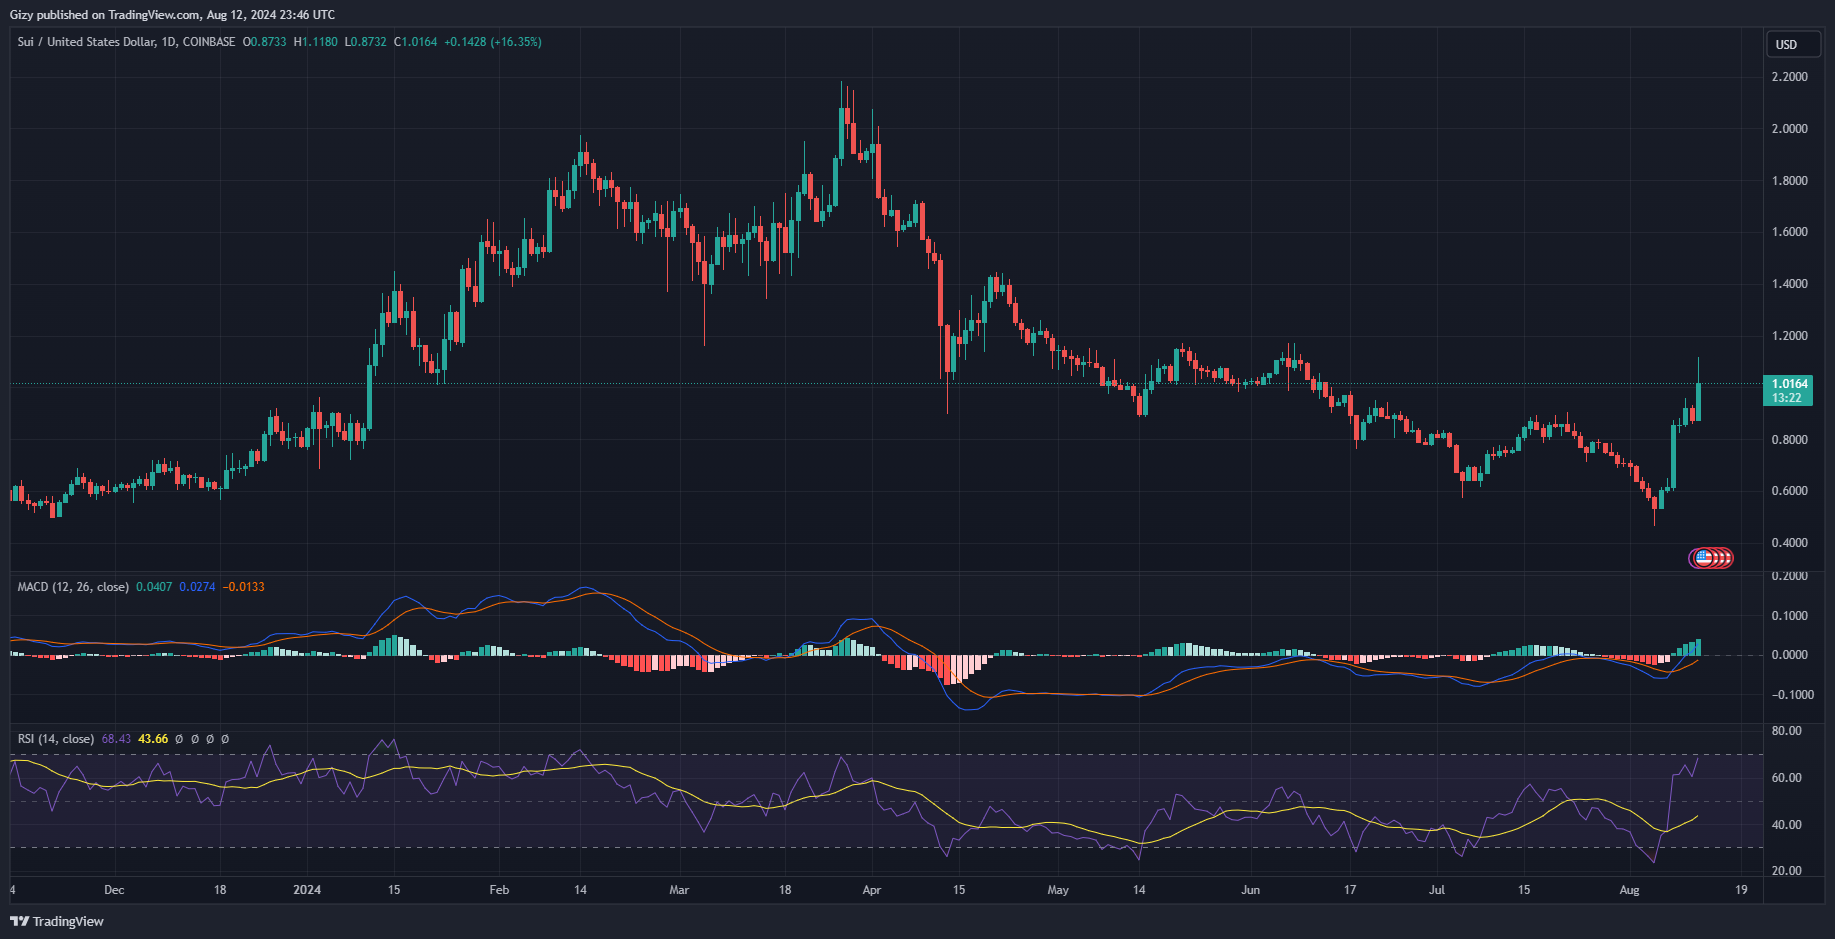
However, it retraced as it faced rejections at the peak and soon retraced to $1. Nonetheless, the bulls are thrilled the asset reclaimed this level after over two months of of trading below it.
The latest surge marks the continuation of the previous five-day surge that took place on from August 6 to 10. It gained over 70% during this hike.
Indicators like the relative strength index are blaring warnings. The metric is at 69 due to the latest surge. The massive buying volume is hinting at the need for corrections, which may start this week. The metric will climb above 70 if the uptrend continues, making the asset overbought.
MACD is still on the uptrend in response to the most recent hikes.
Nonetheless, RSI readings suggest that the stay above $1 is not sustainable. The bulls will look to defend $0.95 in the event of a downtrend. Further slip may send the asset as low as $0.85. On the other hand, the buyers may push prices as high as $1.20.
HNT/USD
Helium has been on an uptrend since the dip that saw it drop as low as $3.47. It has since gained over 53% and is showing potential for more. However, it faced a two-day downtrend that saw dip to $5.62 and lot over 12%.
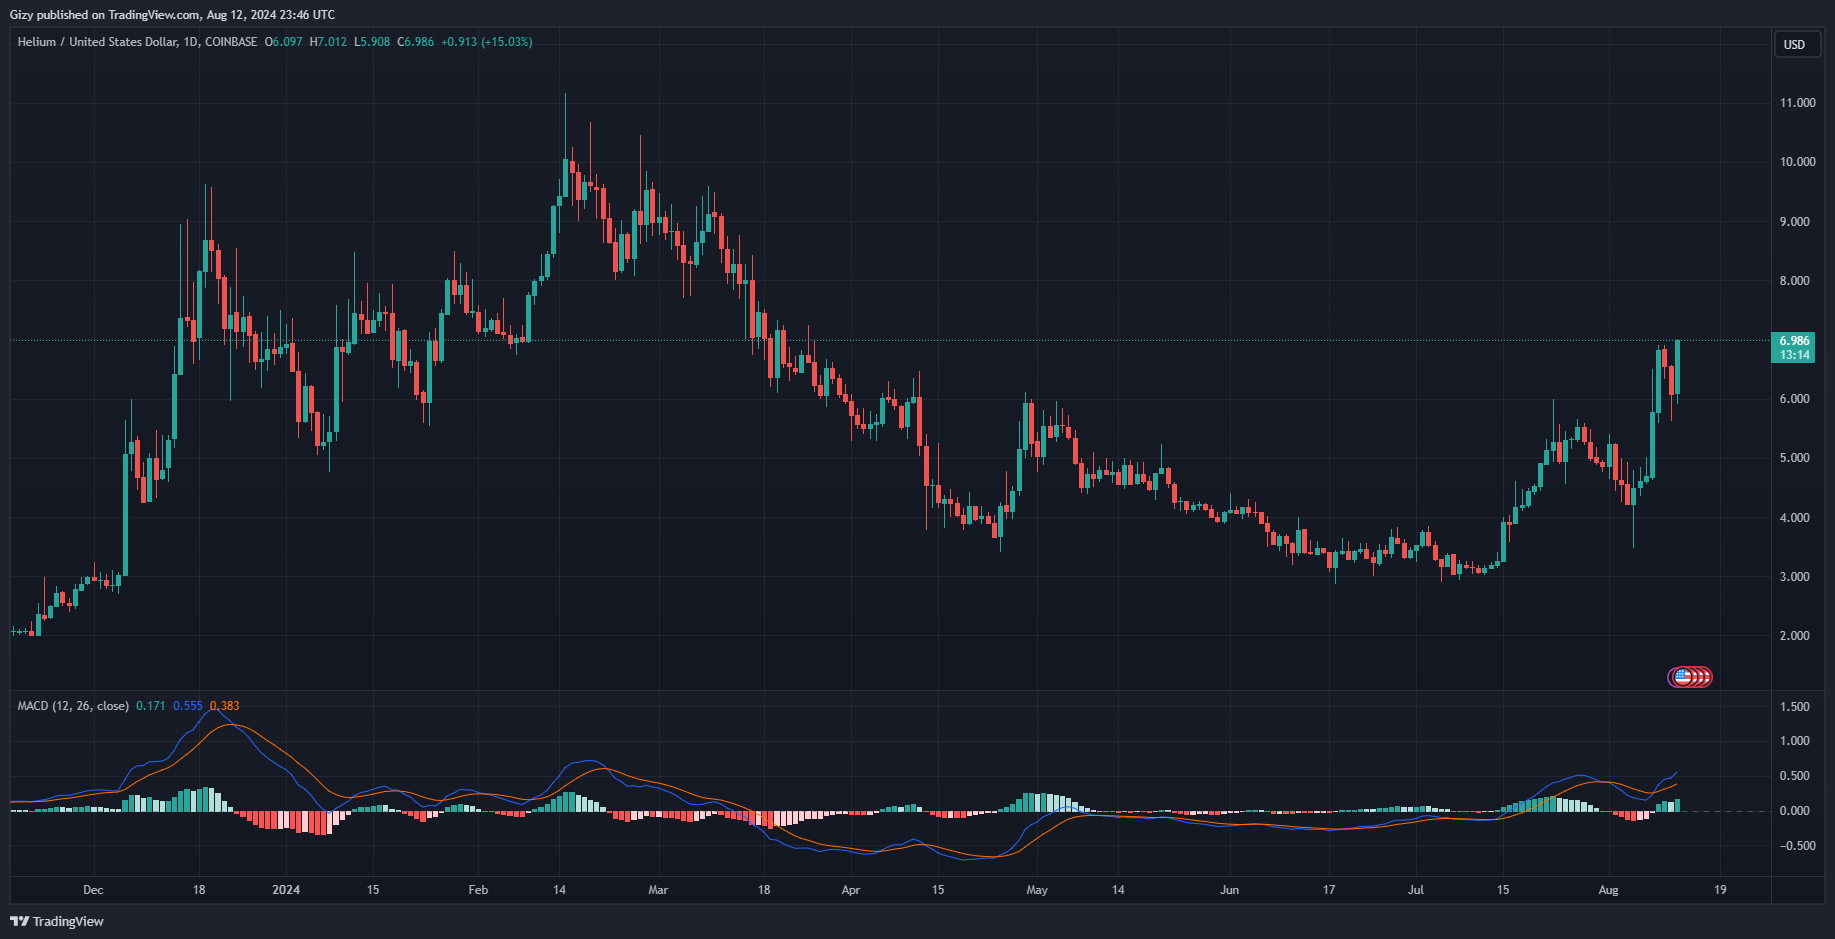
The current day saw it erase the losses as it peaked at $6.98 and is up by over 14%. However, the surge may be coming to an end soon.
Indicators such as the Relative Strength Index (RSI) are flashing caution signals. Following the recent surge, the RSI has reached 69, suggesting the possibility of a correction. The significant buying volume hints at the need for a pullback, which could occur this week. If the uptrend persists, the RSI may rise above 70, indicating that the asset is becoming overbought.
