XRP is on its third day of consecutive downtrends. It registered slight declines surging the previous intraday session as it lost momentum after testing its three-day high.
XRP price trend reflects the movement of other crypto assets as the market sees less trading volume in the early hours of Saturday. The global cryptocurrency market dipped to $3.57 trillion from its high of $3.65 trillion. The 3% decline in cap comes amid growing positive sentiment. The fear and greed index is at 61, indicating greed.
The top 100 shows several assets with significant declines over the last 24 hours. Official Trump is one of the top losers during this period, dipping from $32 to $26. The memecoin is down by over 20% in the last 48 hours. Dogwifhat experienced a similar dip, retracing over 11% in the previous 24 hours.
The crypto market eagerly anticipates Donald Trump’s new policies that may trigger more adoption for the crypto market. Some Bitcoin proponents accused Ripple of being the deterrence that stopped the US president from signing the executive order to start a Strategic Bitcoin Reserve.
A look at the top 100s reveals that most assets are down significantly over the last seven days. Let’s examine the top 10.
BTC/USD
Bitcoin started Monday with notable increases, surging from $101,191 to a new ATH of $109,356. The coin stopped at a few hundred dollars from $110k. It lost momentum and closed at its opening price. Tuesday was more bullish as the apex coin gained almost 4% following its climb to $107k
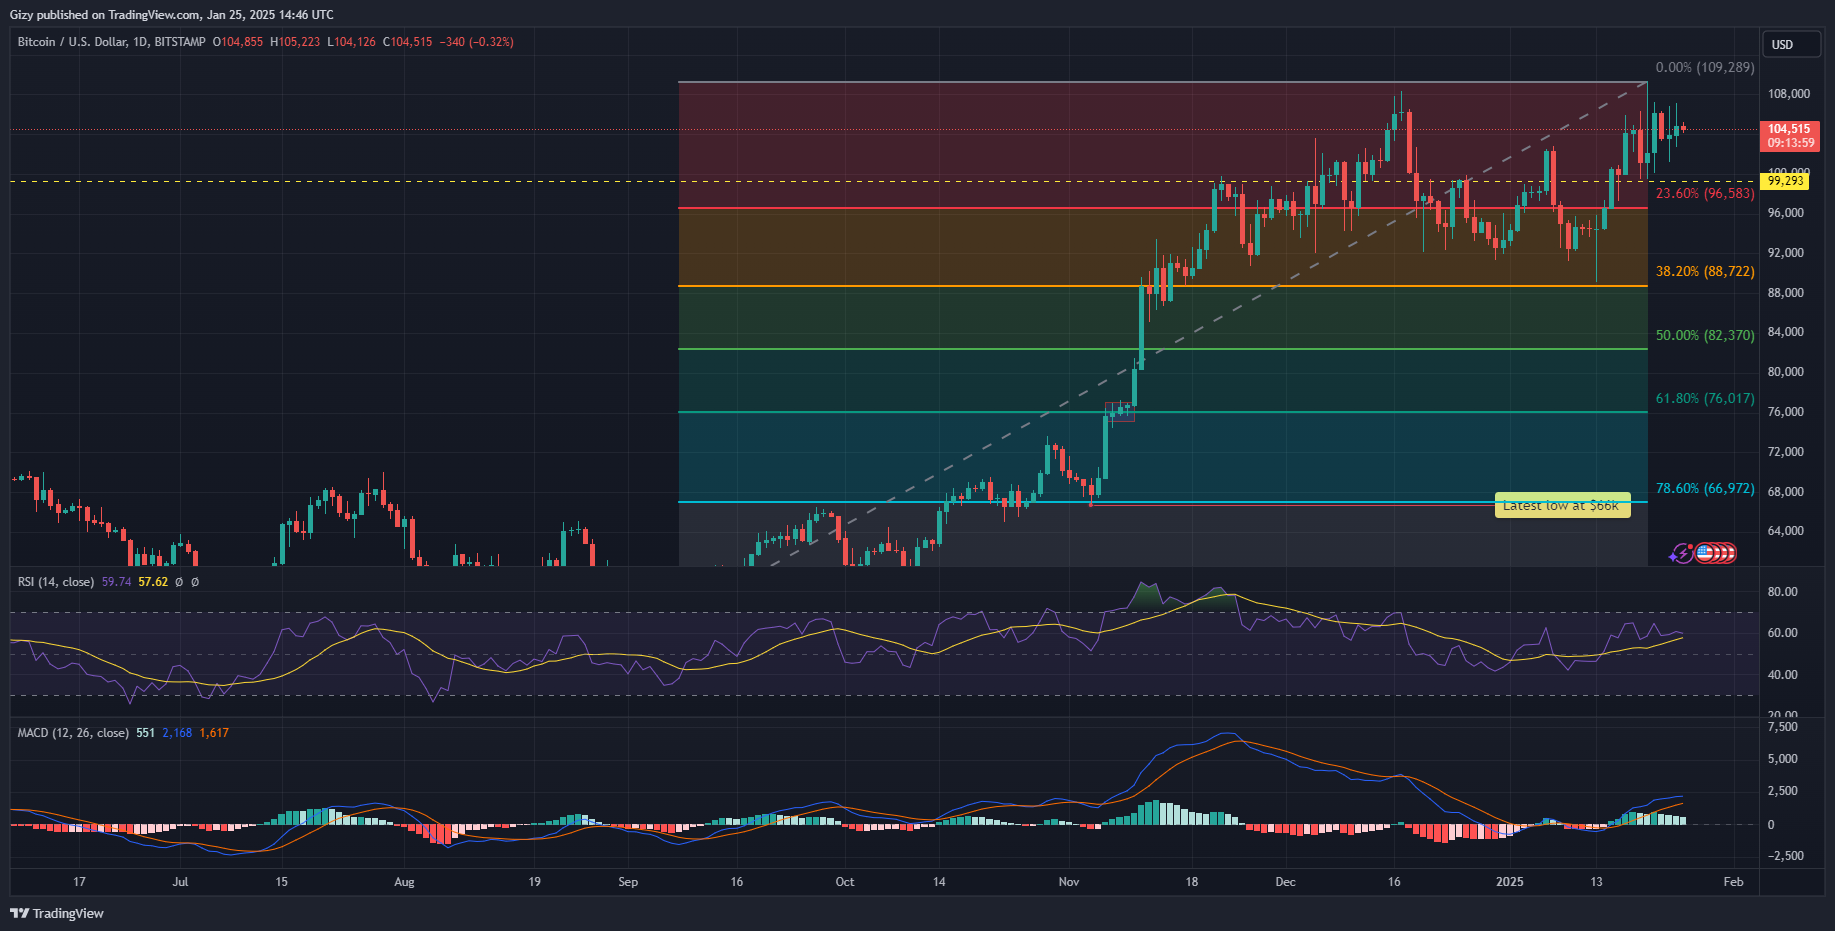
However, this was the cryptocurrency’s last significant increase, as it failed to register notable increases. The same trend is ongoing,, as BTC has yet to experience a massive price move. Due to the low trading volume, it prints a doji.
The apex coin trades close to Bollinger’s upper band. Its latest price trend comes after it briefly broke above the bands on Monday. Traders fear further descent as MACD’s 12-day EMA slows its uptrend due to dwindling buying pressure. They fear the start of a bearish convergence that may lower prices.
Nonetheless, BTC trades above its 23% fib level. It must hold the $100k mark or risk dipping as low as $96k.
ETH/USD
Ethereum, like XRP and other cryptocurrencies, registered significant increases on Monday. It surged to $3,448 but lost momentum and retraced to $3,280. The next day, it tried continuing the upticks with limited success because it failed to break above $3,400.
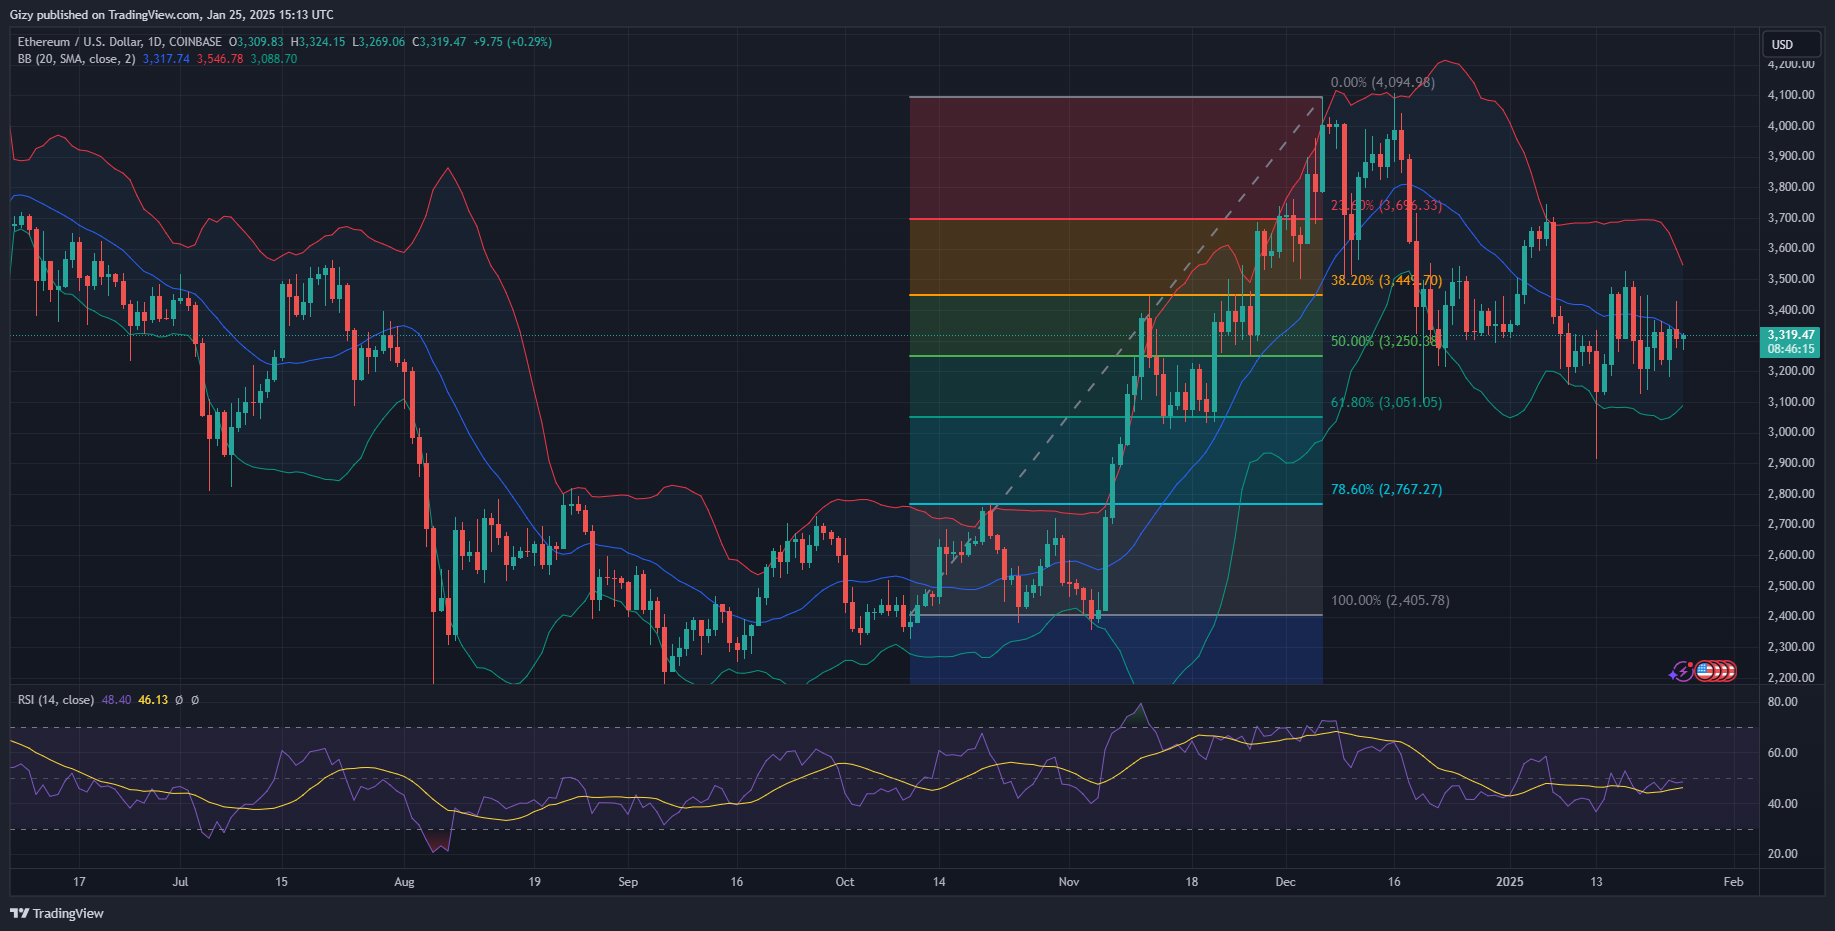
Since then, the asset has been rangebound, hitting a high of $3,400 and a low of $3,181. The latest exchange between the Ethereum community and investors sparked mixed feelings about the asset. While some claim it may be the start of something new, others contend it may negatively impact the coin.
Nonetheless, indicators remain positive amid the turmoil. The moving average convergence divergence hints at further despite the ongoing declines. The 12-day EMA is on the uptrend, trading close to bollinger’s upper band.
The altcoin is facing notable resistance at Bollinger’s middle band. At $3,250, it trades close to the 50% Fib level. The asset must maintain this critical mark or risk a decline below $3,100.
XRP/USD
XRP attempted its previous high on Monday, surging from $295 to $3.36. However, it retraced, closing at $3.10 with gains exceeding 5%. It continued upwards, hitting a high of $3.24 the next day. It has since seen less price volatility since this price action.
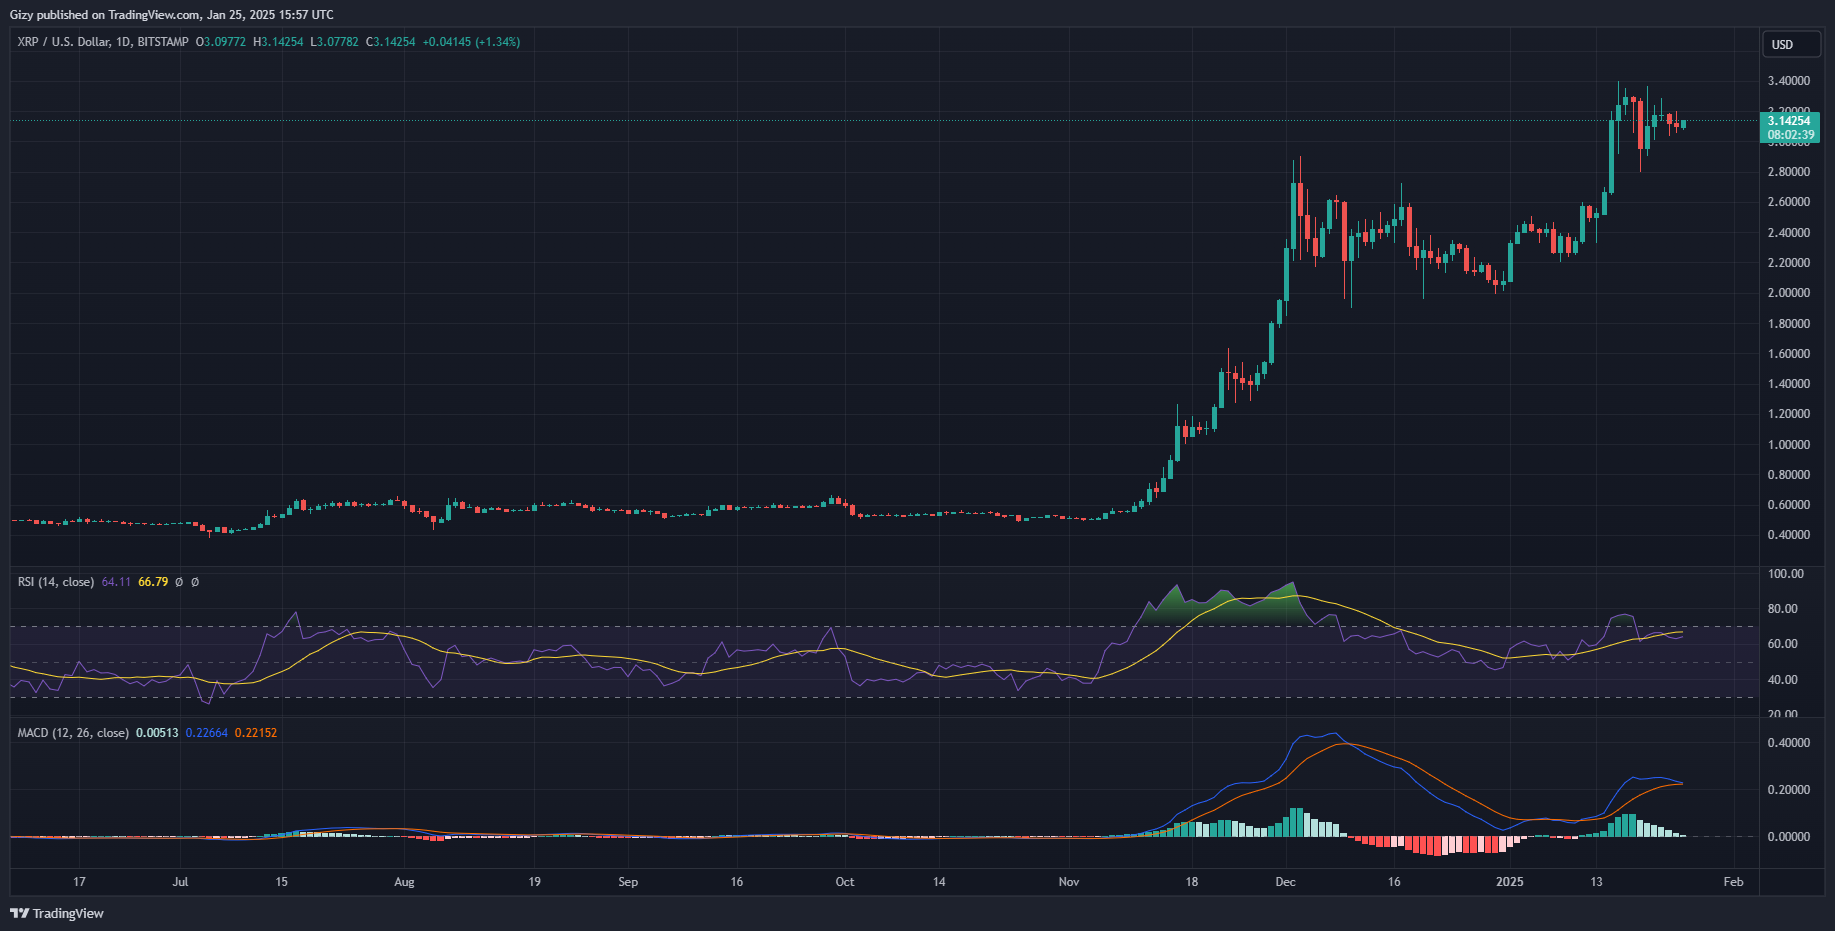
Traders fear further price descent as indicators turn bearish. The moving average convergence divergence is undergoing a negative interception. The 12-day EMA is in contact with the 26-day EMA. If trading conditions remain the same, a divergence may start in the coming days.
The altcoin must hold the $3 support or risk a dip to the 23% fib level at $2.70.
SOL/USD
Solana saw massive volatility over the last seven days. It opened Monday at $253 and experienced massive increases that sent prices to $273. It failed to continue upward, losing over 4%. It recovered the next day and continued upwards on Wednesday. It peaked at $273 but retraced below $260.
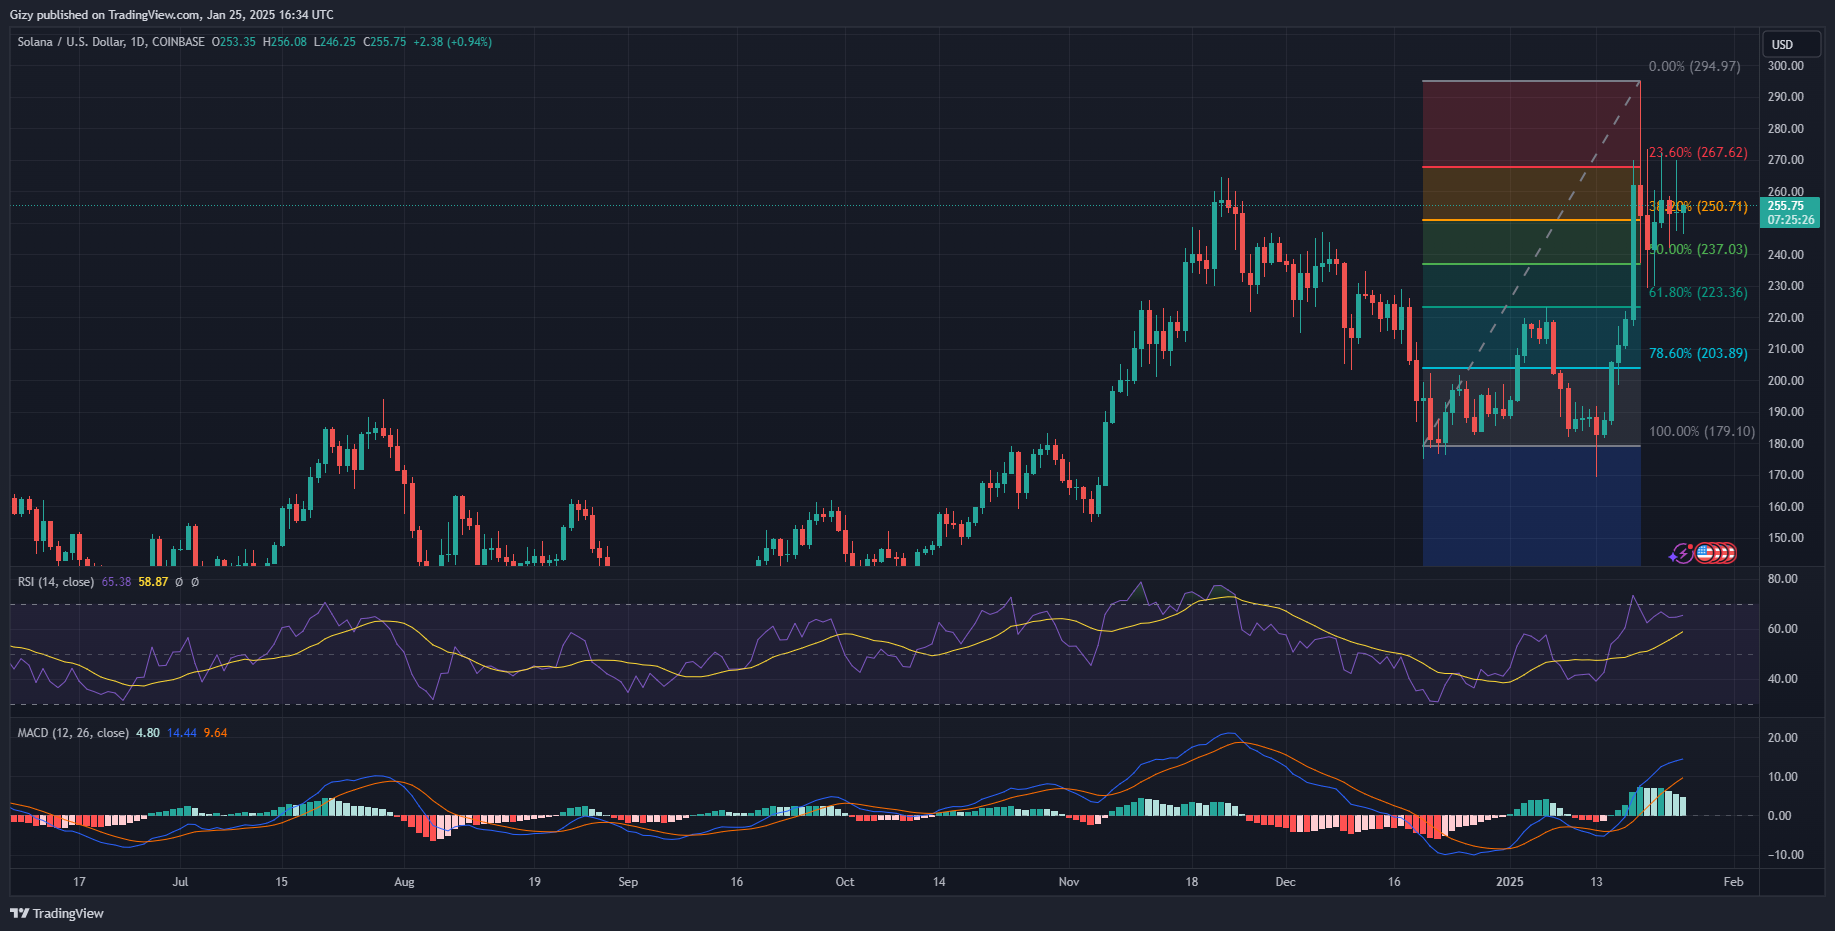
The asset has since closed below the $260 mark. It recovered from a low of $246 earlier today and trades at $255. However, MACD’s 12-day EMA slows its upside movement as the histogram bars reduce. It dropped below the 38% fib level at $250.
The asset must maintain trading above this key level as further declines may send it to the 50% fib mark at $237.
BNB/USD
Binance coin prints its first green candle after two days of notable declines. The asset dropped to a low of $674 during the previous intraday session. It trades at $686 at the time of writing as indicators react.
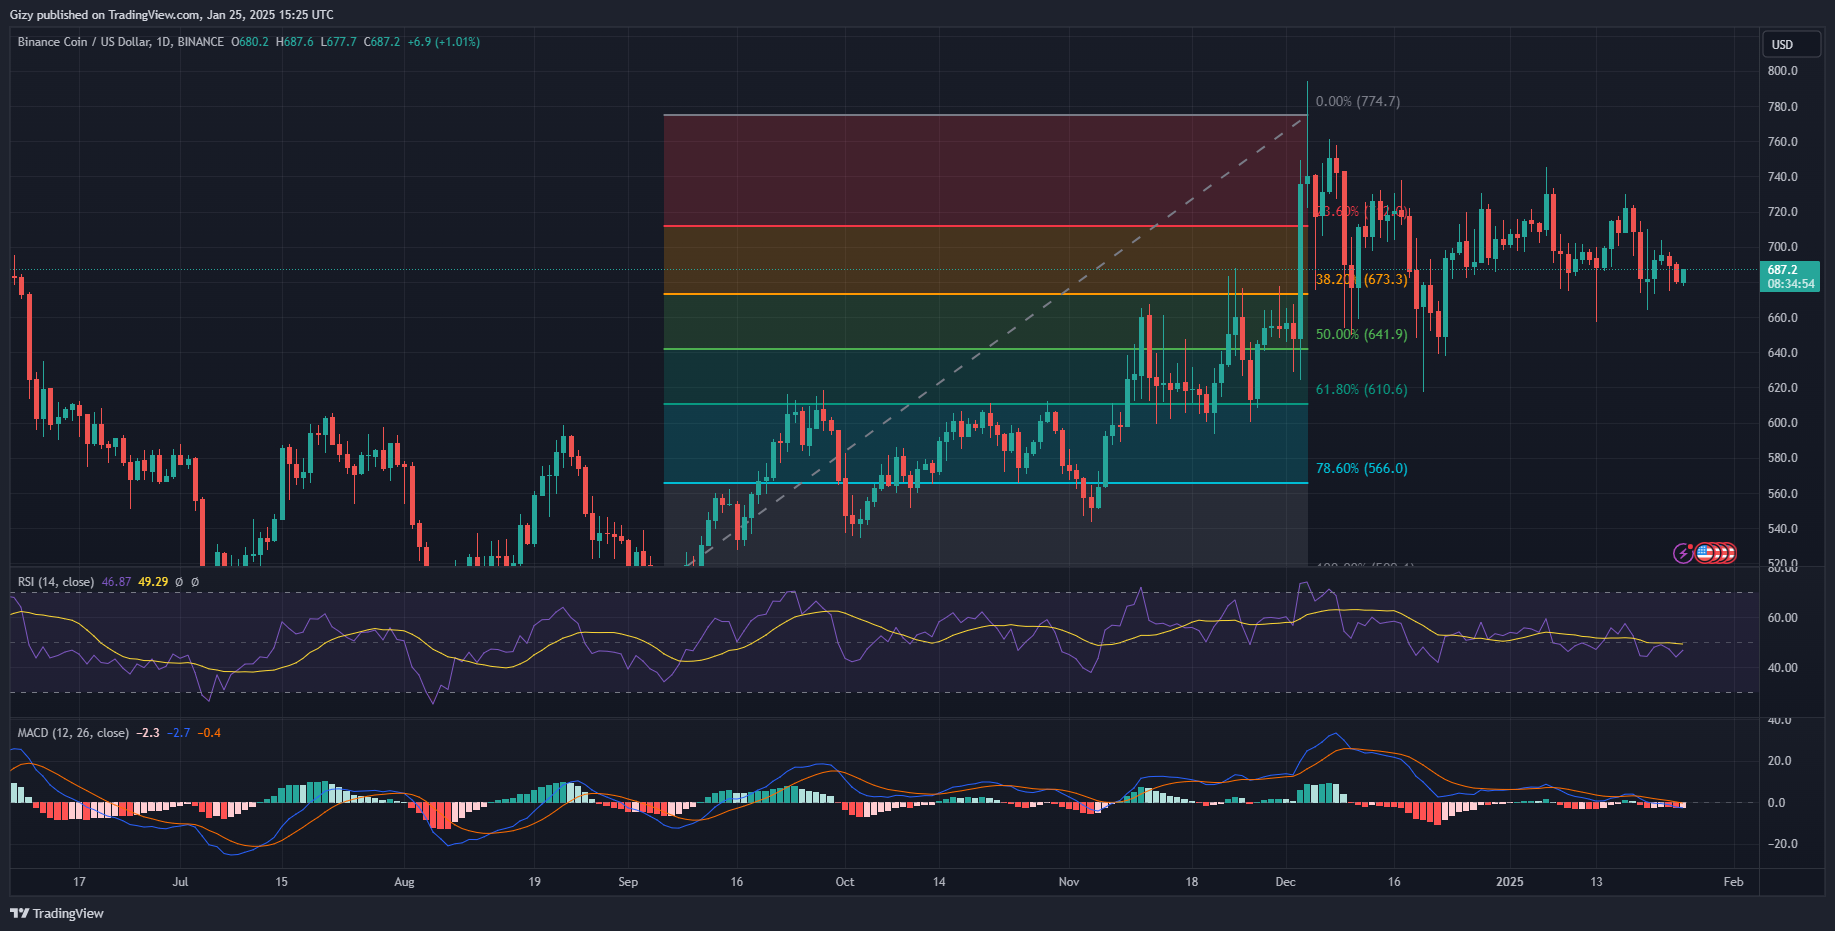
The Bollinger bands show the altcoin trading slightly above the lower band. The latest reading comes after it tested the metric on Thursday. Its latest rebound may be in response to this event, which signifies the end of the downtrend.
MACD is slightly improving following a small price improvement. The moving average convergence divergence’s histogram is reducing as the cap between the 12-day and 26-day EMA reduces
DOGE/USD
Dogecoin is forming a bearish wedge at the time of writing. Nonetheless, it’s printing its first green candle in the last three days. The latest trend started after the asset surged to $0.40 on Tuesday. It dropped to $0.37, closing with gains exceeding 5%.
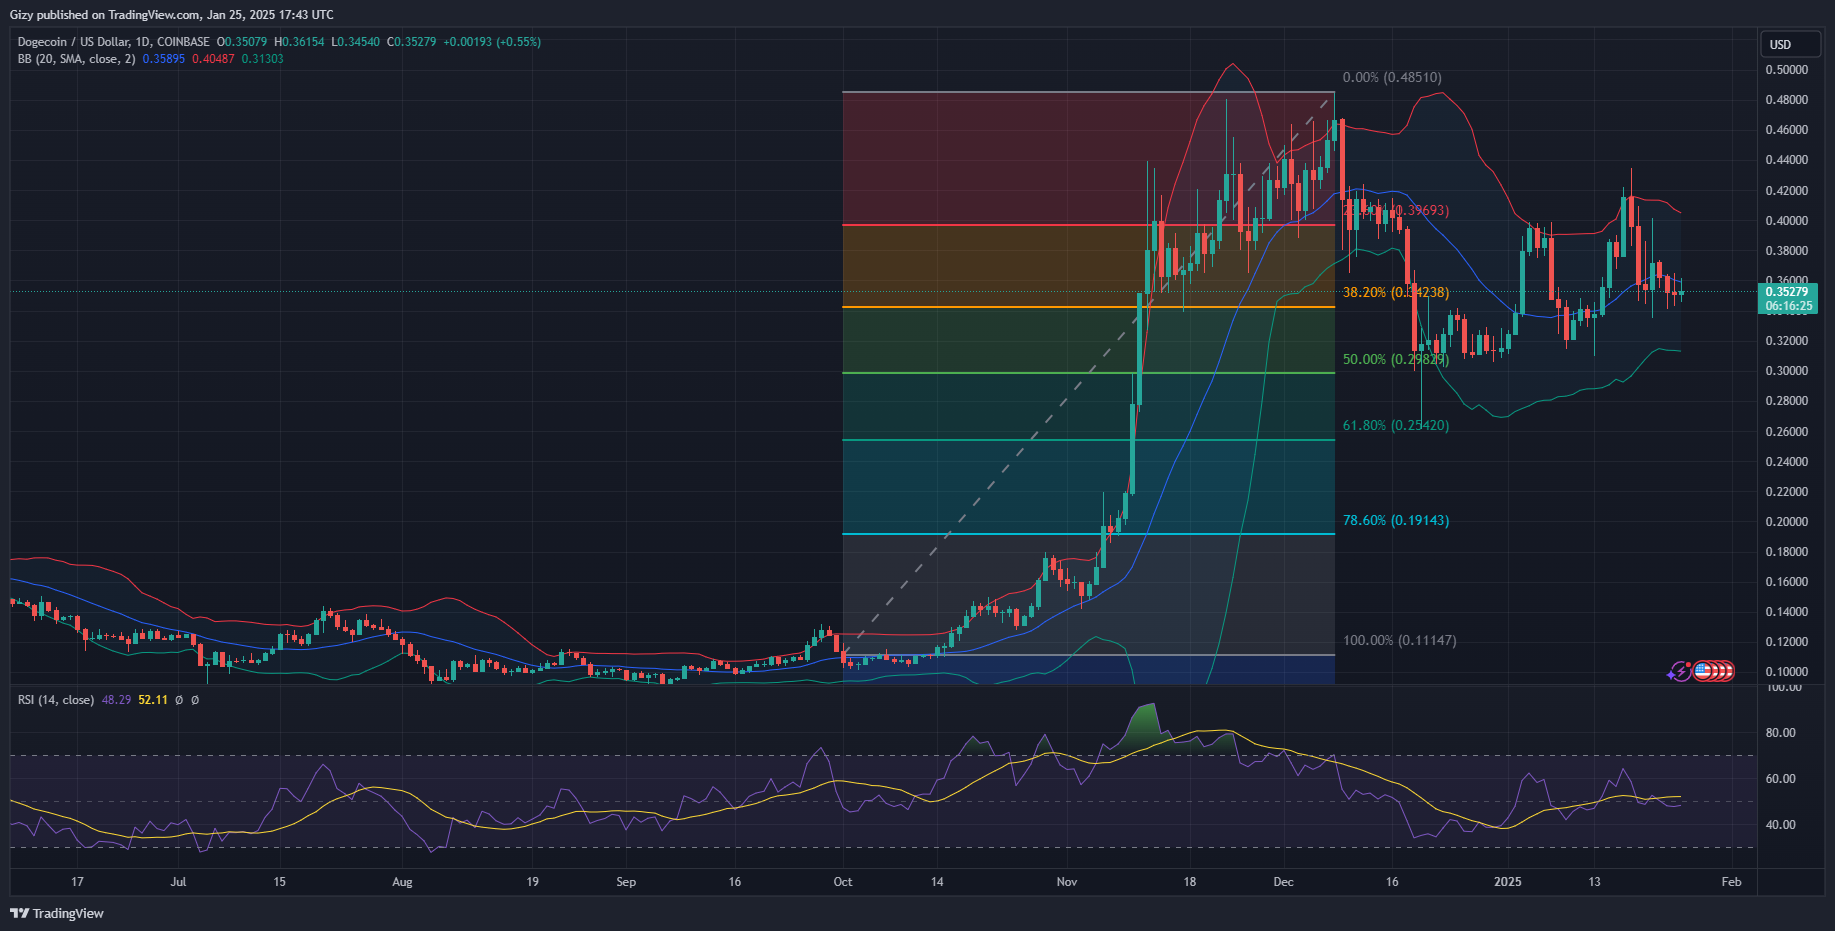
The asset had bearish divergence as trading conditions worsened. MACD’s 12-day EMA intercepted the 26-day EMA, and both metrics are on a downward trend. The relative strength index is reveals a significant struggles for dominance between the buyers and sellers.
RSI remains stable amid as the asset failed to register any significant price change. The low volatility is evident in the dojis representing trading actions over the last two days.
The bollinger band shows the asset trading close to the middle band. It trades close to the 38% fib level. It must maintain this mark or risk dropping to $0.29.
