Ethereum classic trades at $27 at the time of writing as it retraced from its peak. The token is on the rise, ignoring the prevalent bearish sentiment across the crypto market.
It latest surge leaves Ethereum behind as it grapples with notable selling congestion. ETH prints a doji as it recovers from its previous dip to $3,181. The apex altcoin experienced massive rejection after it attempted the $3,300 mark a few hours ago.
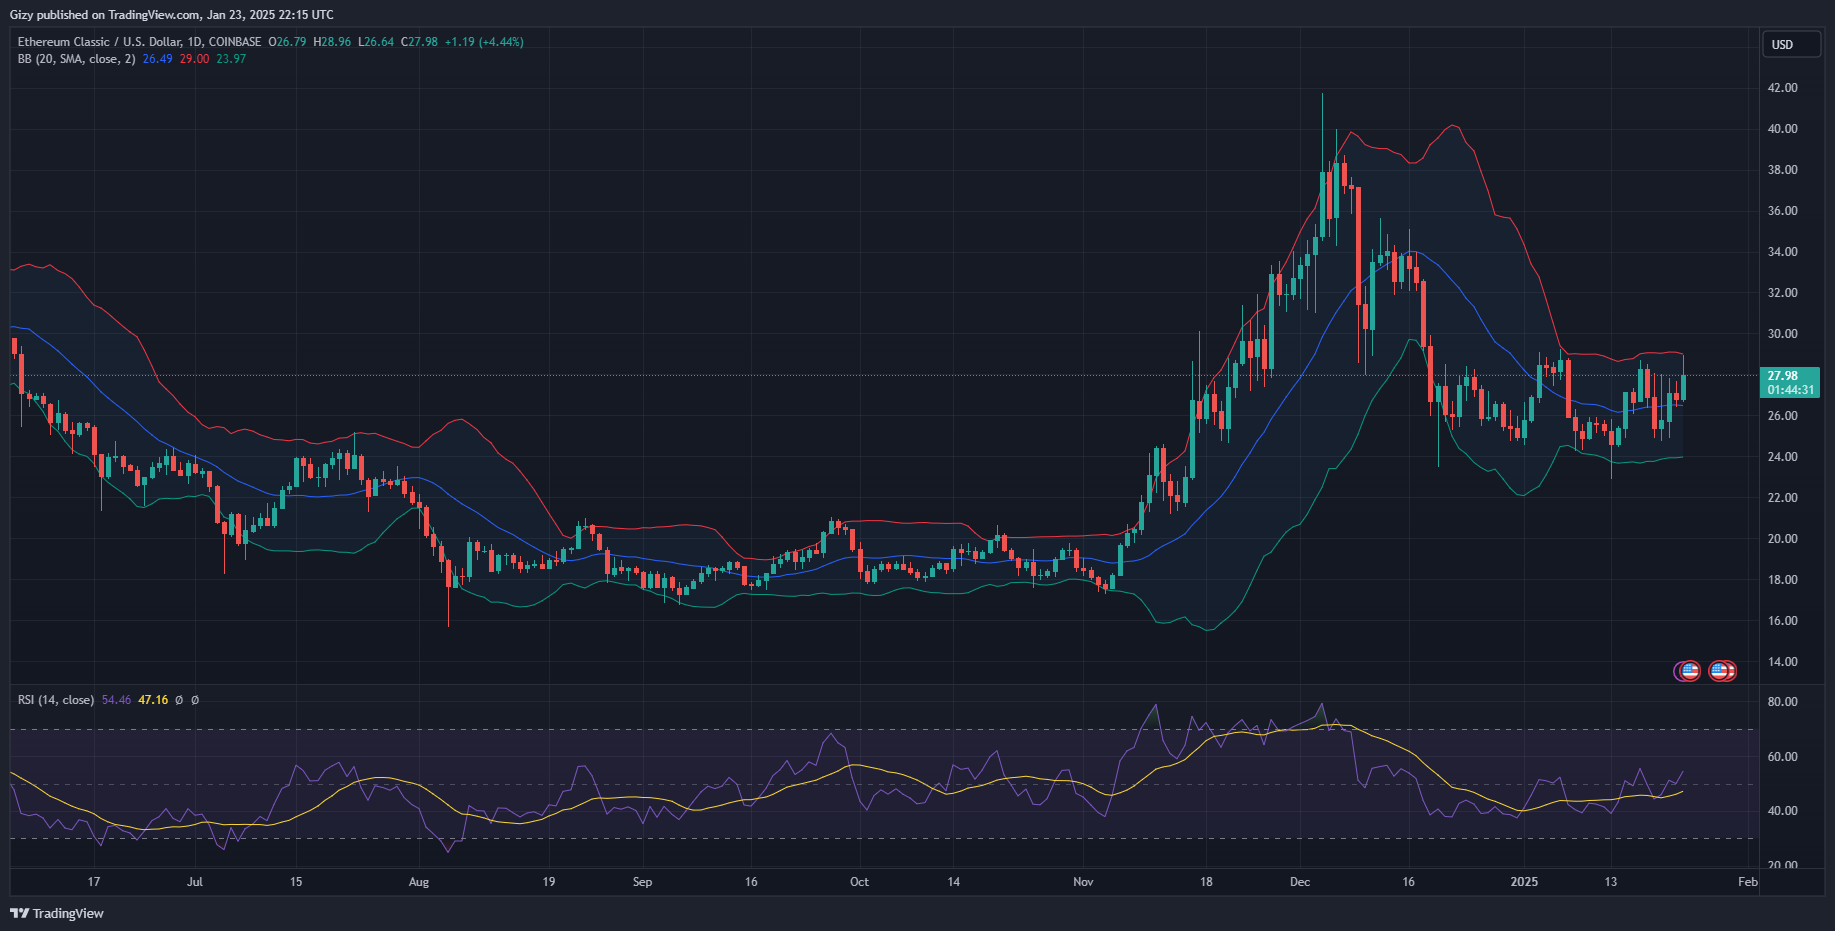
ETC surged to a high to a high 0f $29 as buying pressure increased. However, it lost momentum as it approached the critical $30 mark. The altcoin has failed to break above the mark since slipping below it in December.
It attempted on two occasions before the most recent but failed as it lost momentum at $28. The most recent trial took place on Friday as it gained 6% but experienced significant profit-taking the next day, halting its uptrend. The asset remains rangebound between $28 and $24. Investors expect a breakout soon.
Thinning Bollinger Bands
The token less volatility than the previous month. The bollinger band is reacting to this trend, closing its channel. A thinning of this metric indicates typically an impending breakout. This time may not differ as the asset traded with the channel for almost twenty days.

The moving average convergence divergence prints bullish signals, pointing to improving trading conditions. The 12-day EMA is on the rise after its previous bearish convergence. RSI is rising in response to the growing buying pressure.
However, ETC is at crossroads. It recently test the bollingers upper band which may be a negative sign as correction may follow. It is also worth noting that it may retrace as indicated by previous price movements. The altcoin retraced from $28 to $24 following its failed attempt on Friday.
The positive indicators like MACD and RSI may herald the breakout traders anticipate. Ethereum may surge as high as $32 following the event. On the other hand, the bulls must keep prices above the $24 as previous price movement hints at possible decline to $22 following a slip.
HYPE Loses 9%
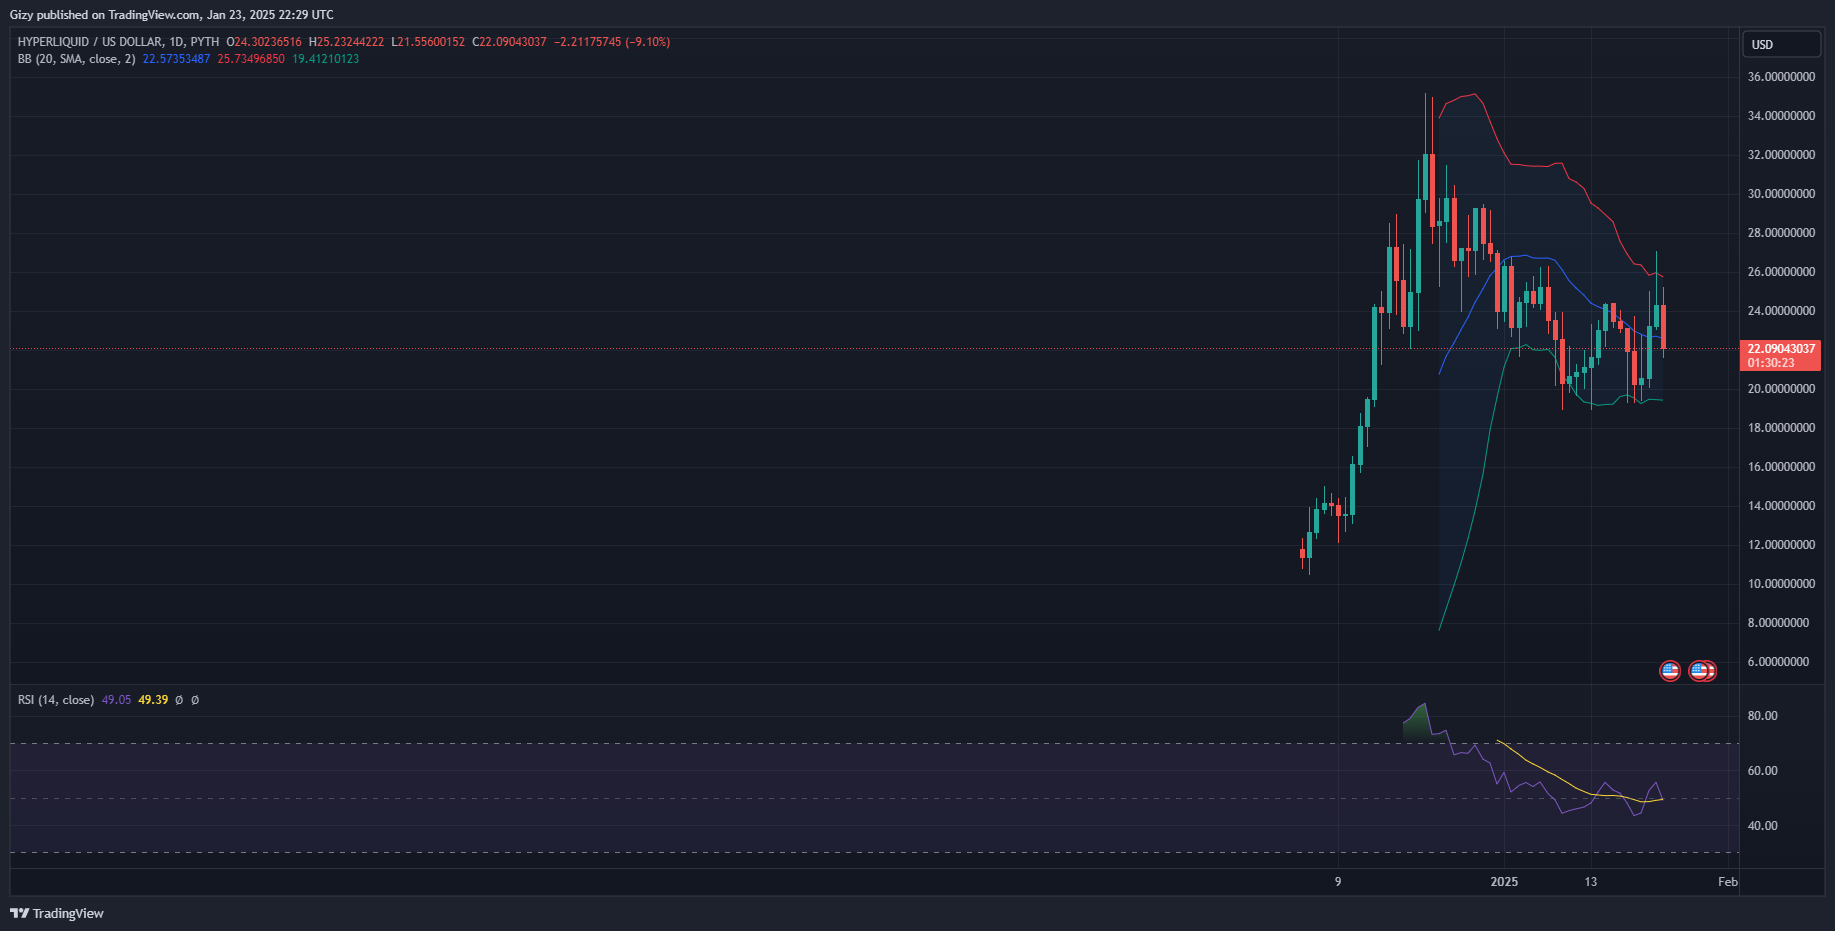
On Jan. 23, Hyperliquid surged from $23 to $27 but retraced, closing at $24.3. The previous day’s increase marked its third consecutive day of notable increases.
Trading actions on Thursday reveal that the bulls are exhausted. The bears took over market dominance in the later hours of Wednesday and continued the trend into the current session. The token faced significant resistance to its bid at $25 and dipped, briefly losing the $22 support.

Currently down by over 9%, it may be one of the top losers in the top 100 over the last 24 hours. It remains to be seen if it will recover soon. However, the bollinger bands hint at further declines. HYPE broke above it during the previous intraday session. The ongoing price decline may be in reaction to this trend.
The metric hints at a slip to $20 in the coming days. It is worth noting that the asset tested the mark consistently over the last fourteen days. It may break it.
Hyperliquid joins the list of new cryptocurrencies experiencing notable price declines. Memecoins like AI16Z and Fartcoin are down significantly. They lost 17% and 14% respectively over the last 24 hours.