XRP is on the verge of another massive price move. It is down by almost 3% on Thursday as the crypto market sees notable price declines.
At the time of writing, the market is grappling with significant selling pressure. The global cryptocurrency market cap failed to surge, as it saw substantial outflows amid the over 12% increase in trading volume.
Major crypto assets ETH and SOL registered similar losses. Data from CryptoQuant shows a notable increase in Ethereum exchange reserve as traders dump their bags. The Coinbase premium is negative, showing lesser whale activity. Korea premium bears the same reading as most regions, which shows lesser buying pressure.
XRP is not exempt from the bearish trend, as prices reveal. It sees less attention in the last 24 hours as its trading volume slightly declined. Some indicators on the one-day chart print bearish signals in reaction to the ongoing price trend.
Bullish Fundamentals Amid Price Turmoil
The latest trend is surprising, as the third-largest coin attained a bullish milestone. Ripple recently filed a new suit against the SEC, seeking retribution for the costs incurred in defending its case. The firm won, as the court ruled in its favor.
The latest victory comes as the XRP community eagerly anticipates the dismissal of its ongoing lawsuit with the United States Security and Exchange Commission. Its investors predict that the new head of the SEC will not pursue the case anymore. While some experts expect the resolution to happen in May, other proponents speculate the closure this week.
The community expects further “Deregulation” of the crypto market as Donald Trump announced today plans to make the US the center for AI and crypto. They predict that the third-largest coin may be one of the biggest gainers from the ensuing policies.
XRP May Decline Further
Several indicators on the one-day chart suggest that XRP may see more declines following its almost 3% loss. It is worth noting that it recovered after it tested the $3 support.

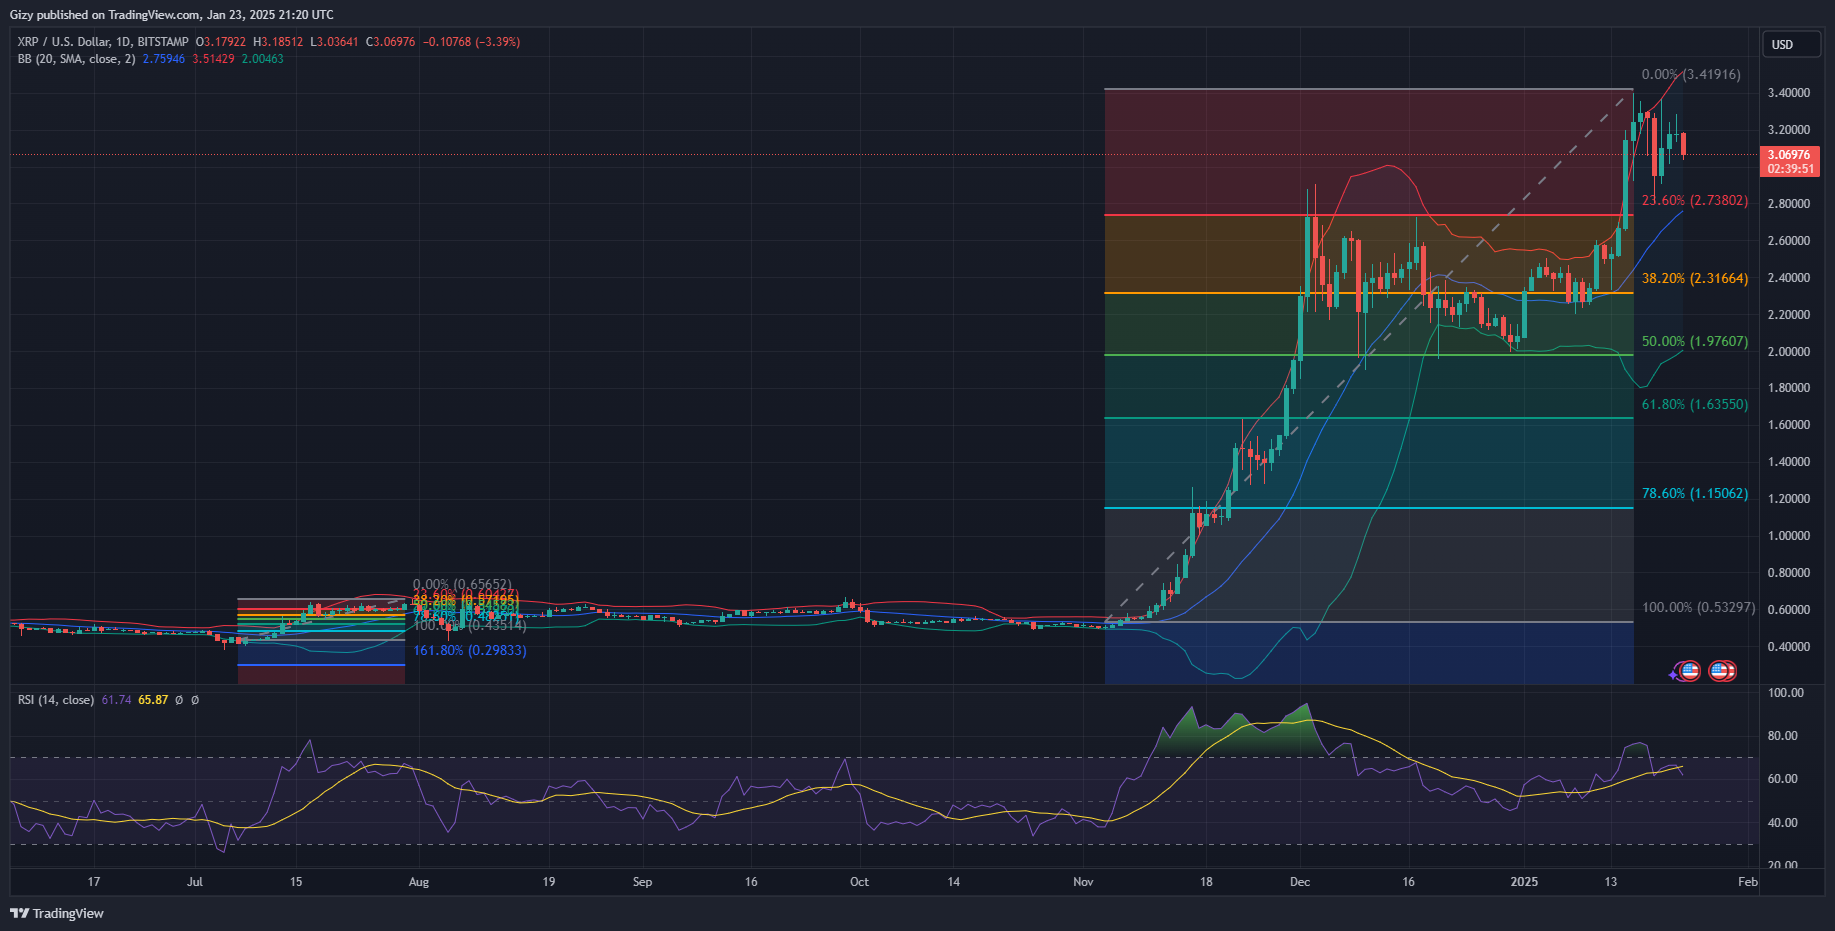
The asset broke out from the Bollinger band a few days ago. Its previous breakouts had notable drawbacks, and the most recent may not be any different, as the other metric prints negative signals. The cryptocurrency may slip below the middle band.
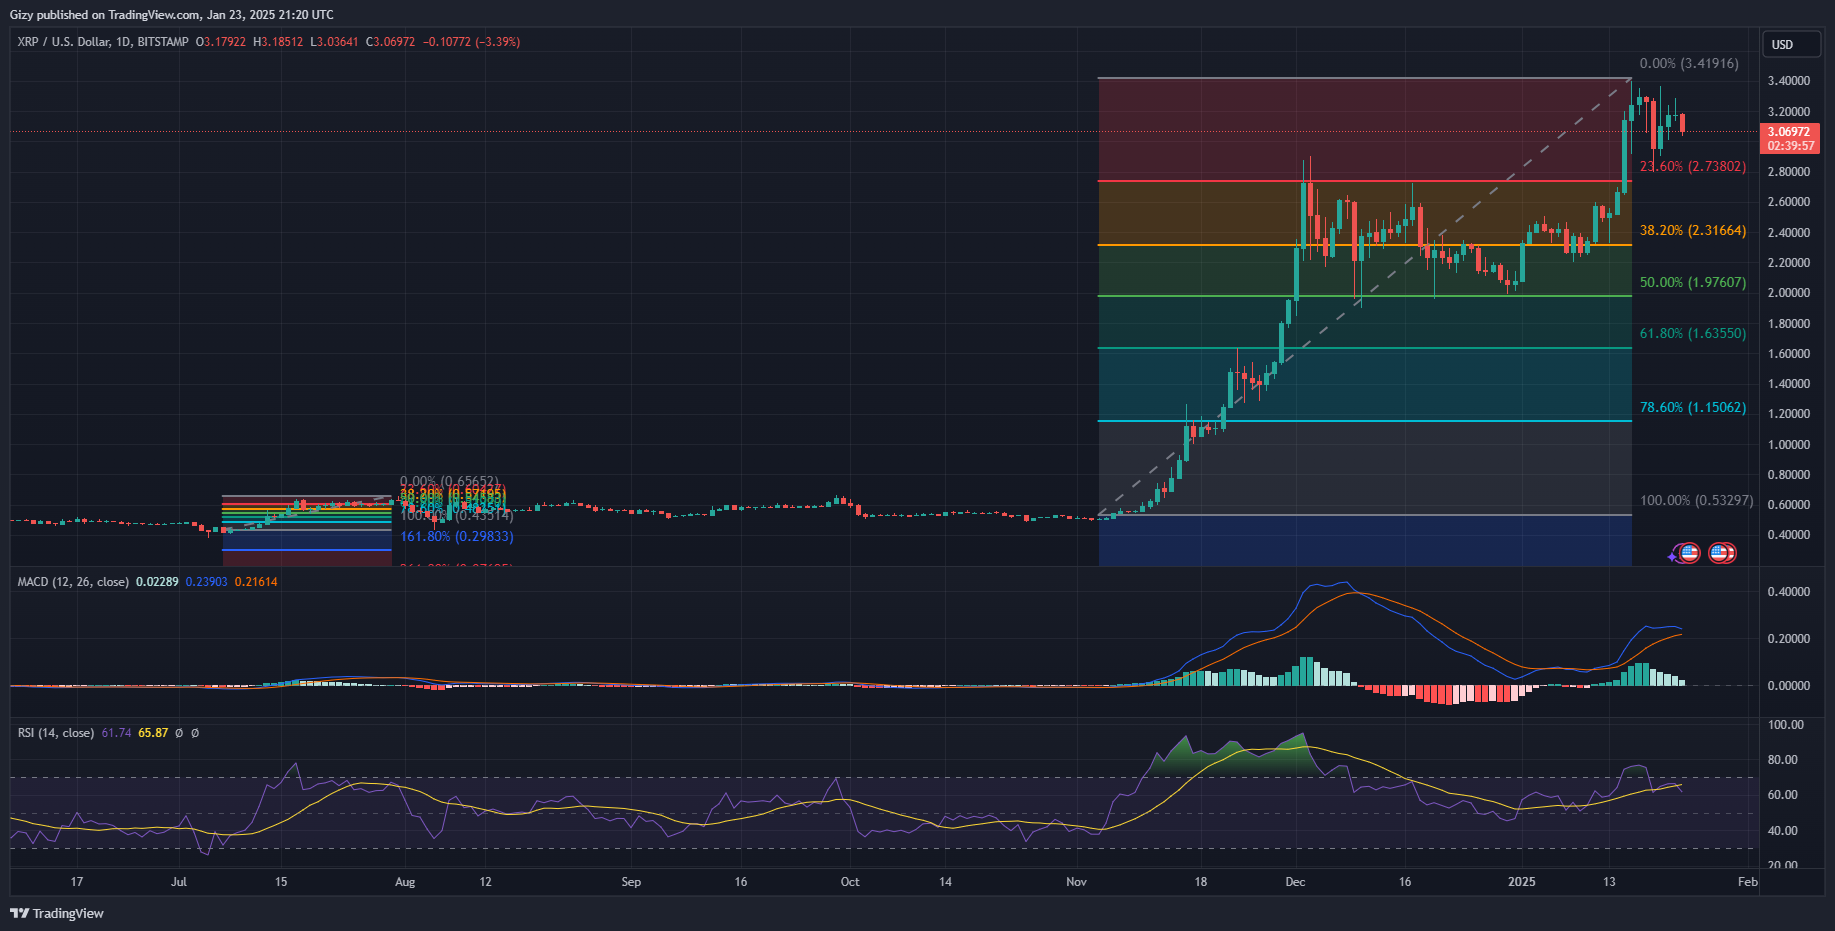
MACD shows an ongoing bearish convergence. The 12-day EMA trended almost parallel over the last six days. However, the trend is changing, as the metric is on a downtrend. This phenomenon signifies impending price declines. The relative strength index reveals that the impending downhill movement may be due to the asset being overbought a few days ago.
How Low Will It Go?
The positive fundamentals may take effect in the coming days, invalidating current chart readings. Nonetheless, XRP may surge, hitting $4.

However, the asset is trading at $3, which is critical support. A few hours ago, it tested the mark, indicating dwindling demand concentration at the mark. The Fibonacci retracement level points to a possible dip to the 23% Fib level at $2.70.
The bulls must defend this mark as a further slip may send the coin as low as the 38% fib level at $2.30.
