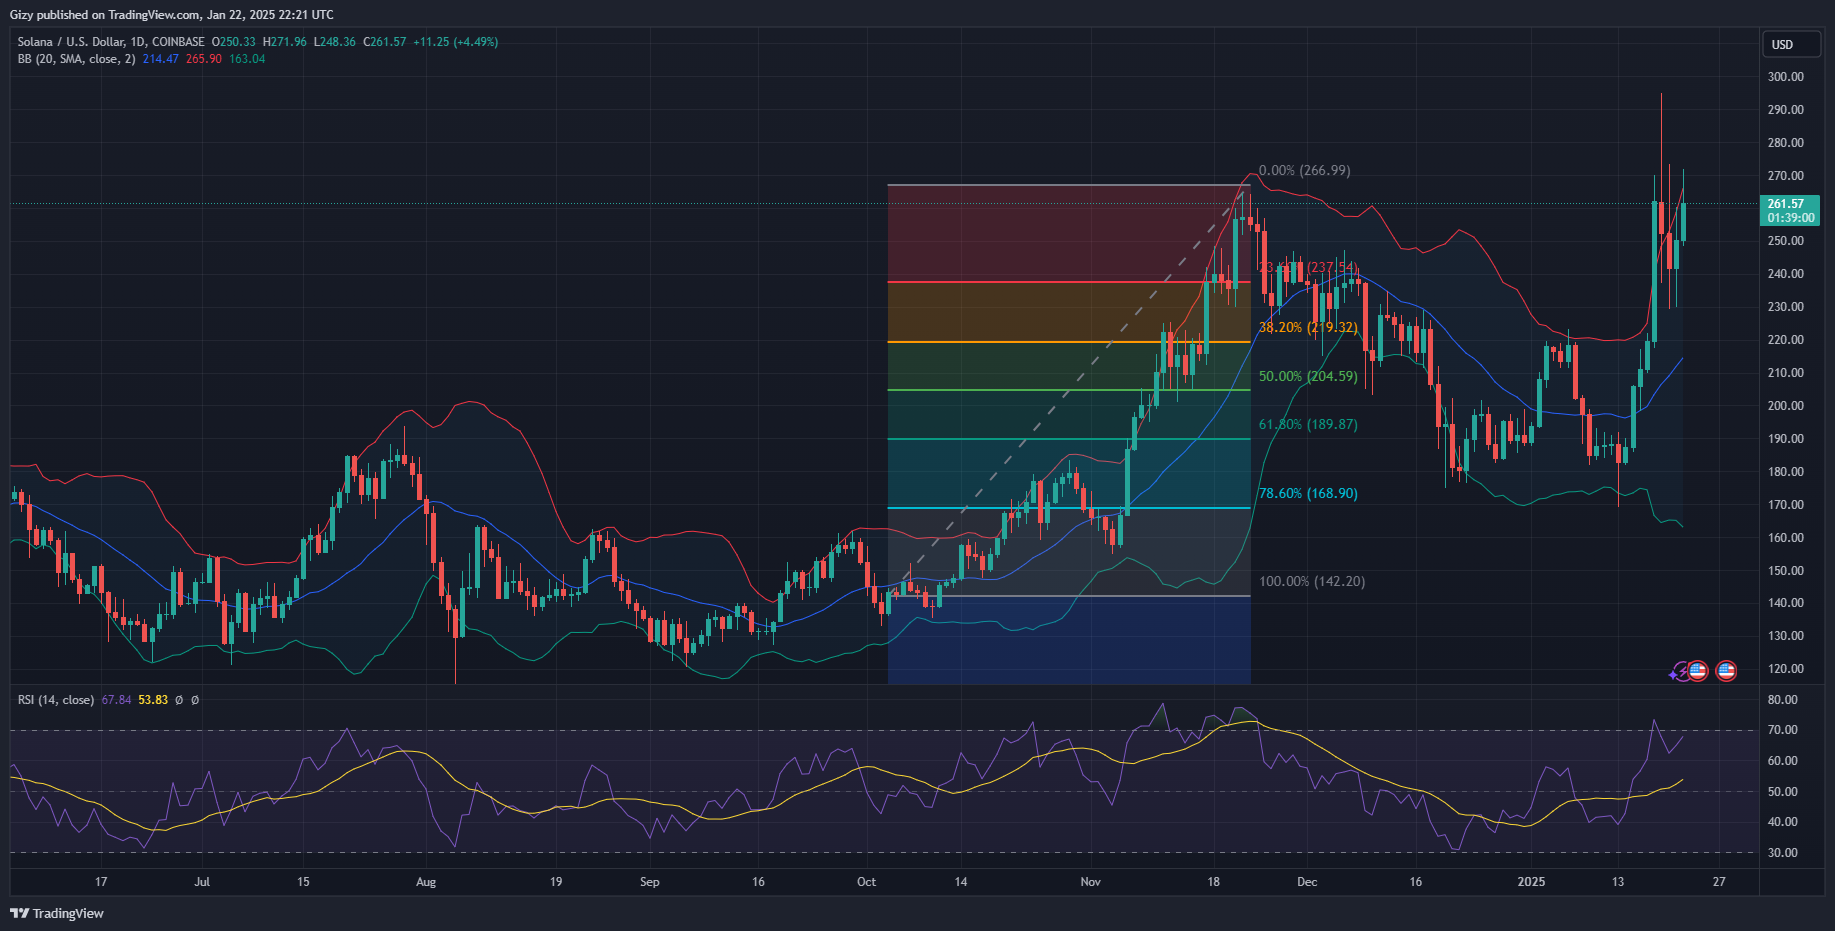
Solana gained over 6% on Wednesday as it sustains upticks for the second consecutive day. Its candle shows that it edged closer to its all-time high but retraced afterward.
The ongoing reflects the bulls resolve to push the coin higher following the massive losses it had Sunday and Monday. The latest two-day uptrend suggests that the bulls are exhausted from the selloffs that followed the ATH four days ago.
SOL opened Jan. 19 at $261 but surged, breaking above $270. It continued upwards, heading for $300, but faced massive rejections at $295. Prices retraced to as low as $237 after the milestone but recovered and closed at $252. It sank lower during the next intraday session, hitting a low of $229.
Solana resumed its uptrend on Tuesday, surging from a low of $230 to a peak of $260. Although it experienced resistance at the peak, it closed with gains exceeding 3%. The ongoing price uptick brings its increase in the last two over 10%.
Why is Solana Surging?
The latest increase comes amid growing bearish trends across the crypto market. Several crypto assets, such as Bitcoin and Ethereum, are in decline. The apex coin dropped over 2%, hitting a low of $103,890. ETH saw a similar decline, losing the $3,300 support and hitting $3,238.
Solana continues to benefit from its ecosystem exposure. Data from Solcan shows a massive trading volume of several assets within its ecosystem, resulting in huge revenues. The trading volume over the last three days dwarfs its thirty-day performance.
The blockchain saw an average of $11 billion in volume for most of the last thirty days. The trend changed on Jan.18 as it spiked to $37 billion and $47 billion the next day. Trading volume as of the previous intraday session exceeded $29 billion.
The Official Trump Token and Melania made waves during this period, causing massive FOMO. However, the trend is gradually dying as $TRUMP struggles to break above $40 after peaking above $70 a few days ago. The first lady’s token has since struggled to continue its surge.
The interaction between developers and investors grows in Solana. Data from DefiLlama shows an increase in the total value locked over the last 24 hours, from 67.2 million SOLs to 69.2 million SOLs, as transactions significantly surged.
The asset sees a notable increase in flow as traders and developers move their assets for staking and other activities.
Will the Surge Continue?
Data from Santiment suggests the upticks continue. The chart below shows market sentiment against price movement.
A closer look at the chart above suggests that prices are bound to retrace when sentiment is very high but surge when it is low. Market psychology was at its lowest on Tuesday, resulting in a price rebound. The bullish sentiment is gradually picking up, hinting at further price increases.

However, indicators on the one-day chart are primarily bearish. The relative strength index reveals that the bulls may struggle to continue the uptrend as the metric trends at 68, 2 clicks away from 70. A breakout from this level will cause the asset to become overbought and due for more declines.
Solana currently trades slightly below Bollinger’s upper band. A surge above this critical level may result in further declines for the altcoin.

