BTC experienced a massive decline a few hours ago. It retraced to a low of $89,164 for the first time since November. BTC rebounded but trades lower than its opening price.
The apex coin reflects the broader crypto market sentiment, experiencing significant selloffs. As the bears continue their rampage, there is less bullish participation. As selling pressure peaked, the global cryptocurrency market cap dropped from $3.33 trillion to $3.14 trillion.
The news of an increase in the 20-year treasury yield continues to play a massive part in the ongoing price trends. Increasing fear of Donald Trump’s policies is causing significant pressure in the $28 trillion market, and some investors are capitalizing on this. They are moving their assets from the crypto market into low-risk assets.
The week kicks off significantly bearish. Assets like Ethena and Bitcoin SV are 14% and 12% respectively. ENA plummeted from $0.90 to $0.72, while BSV dipped from $59 to $50.
The ongoing downtrend sparks curiosity about when the market will see a trend reversal. Will it be this week?
Top Five Cryptocurrencies
BTC/USD
A previous analysis pointed out that BTC was experiencing a bearish pull. It highlighted the MACD reading and RSI as reasons for this conclusion. The analysis also stated that the apex coin may retrace to $88k, which is what happened a few hours ago.
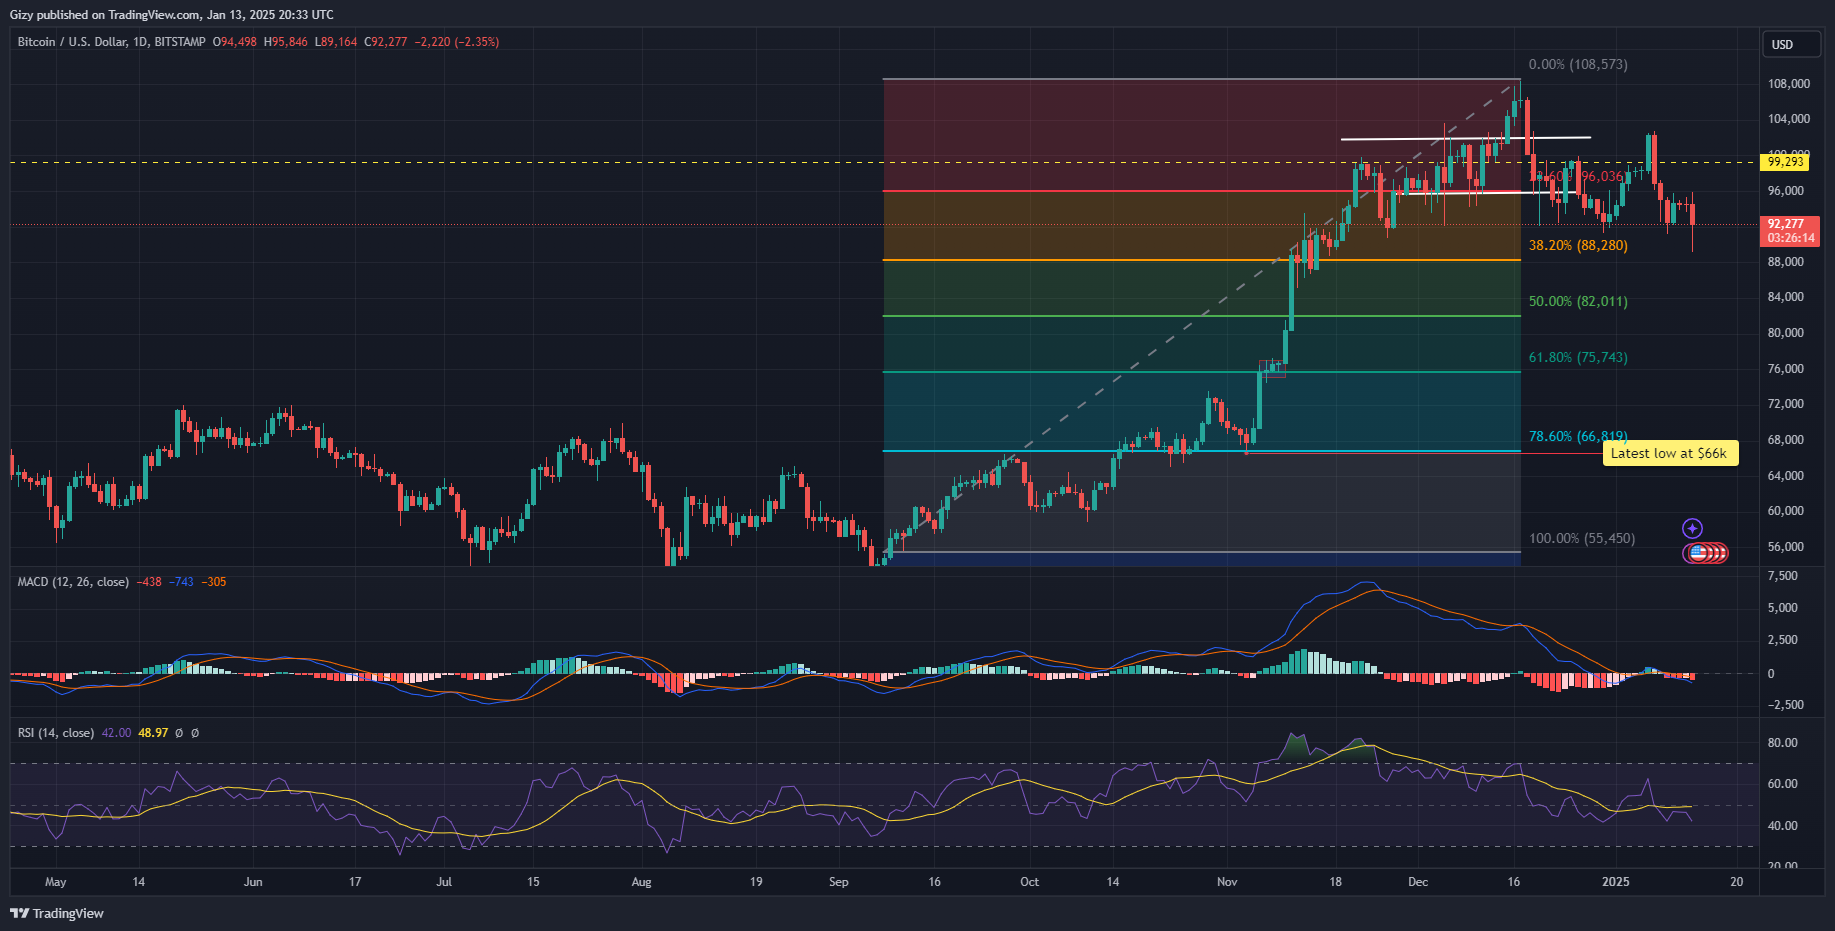
Bitcoin opened the day at $94,500 and edged closer to the $96k barrier but faced notable resistance. It retraced afterward, breaking the $90k support. It dipped to a low of $89k before rebounding. Currently trading at $91,900, the bulls staged a buyback following the decline.
Data from CryptoQuant suggests that the asset is more bullish at the time of writing. Exchange reserves continue to decline despite the massive selloffs. Investors are also moving their assets off exchanges, as netflow is negative 36%. Miners are no longer selling their coins and hold 37% more BTC than the yearly average.
Long-term holders are less active. The low movement from this group of investors indicates less selling pressure at the time of writing. Coinbase Premium remains negative as US traders show weaker buying pressure. The same reading is present in the Korea premium.
The one-day chart remains bearish amidst the positive readings from onchain data. The moving average convergence divergence displayed a bearish divergence a few days ago. The 12-day EMA continues downwards in reaction to the ongoing trend.
BTC risks a slip to $88k if the downhill movement continues. Nonetheless, it may surge above $96k if a trend reversal starts.
ETH/USD
Ethereum is among the worst-affected coins in the top 10 by the ongoing downtrend. It lost the $3,200 support, dipped below $3k, but rebounded at $2,913.
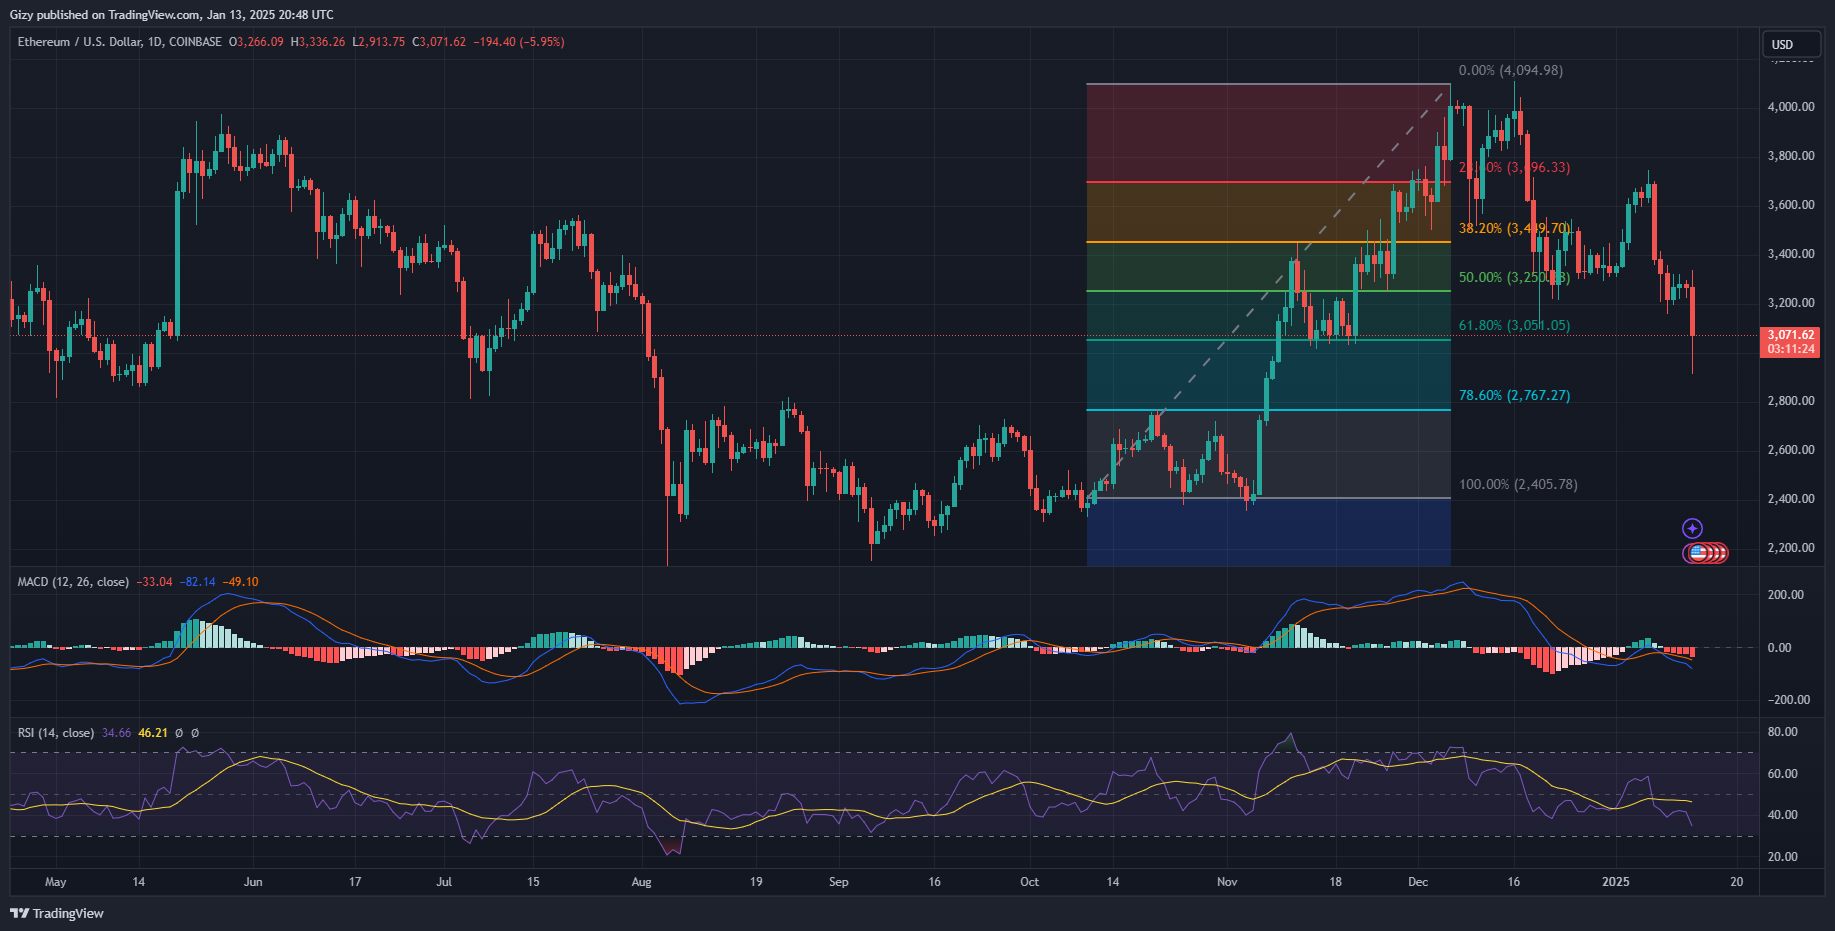
The indicators on the one-day chart suggest that the decline may continue. The MACD continues its descent after a bearish divergence a few days ago. The 12-day EMA approaches its December low. The relative strength index is at 34, close to 30. If the downtrend continues, the asset may become oversold.
The apex altcoin lost the 61% fib level a few hours ago but trades close to it at the time of writing. While this is a critical level, readings from other indicators suggest further declines. ETH risk further dips to the 78% fib level at $2,700.
Onchain data hints at a trend reversal. Although the exchange reserve is slightly up, investors are massively moving their assets from exchanges. They transferred over 50,000 more assets in the last 24 hours than they did a few days ago.
XRP/USD
XRP’s bounce rate soars as it quickly recovers from its previous downtrend. It opened the day at $2.50 but retraced to $2.32 as selling pressure mounted. However, it trades very close to its opening price. Printing yet another doji, the third-largest cryptocurrency, may close the day with no notable change in price.
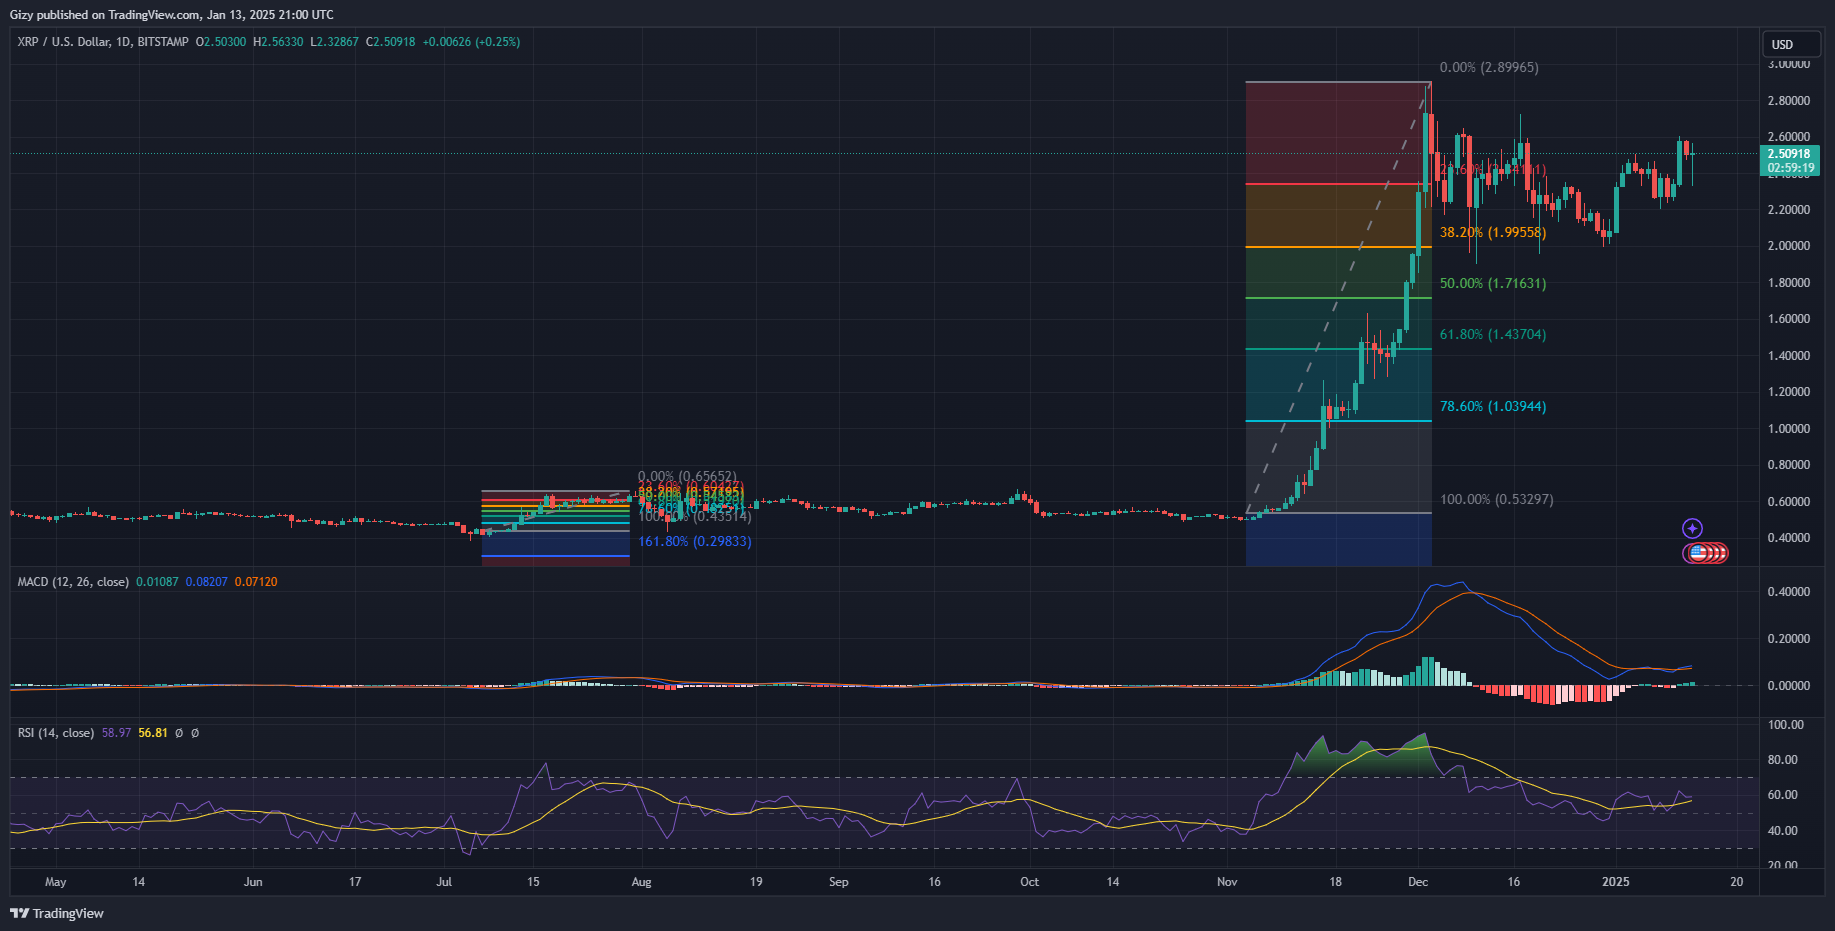
The moving average convergence divergence had a positive interception a few days ago as the asset surged. Its recovery shows the bulls are still committed to causing further uptrends. The 12-day EMA continues upwards as the histogram associated with the metric displays increasing bars.
RSI trends parallel at 58 due to the latest price action. The XRP/USD pair remains above its 21% fib level at $2.34. If the bulls sustain the upward drive, it may test the $2.90 barrier in the coming day. However, it must break the $2.66 barrier.
On the other hand, it may retrace to $2.20 in the event of a trend reversal.
TON/USD
Toncoin may mark its second consecutive red candle. The bearish sentiment it experienced during the previous intraday session worsened. A few hours ago, the asset lost the $5 support. Currently trading at $5.27, it is nearly erasing all its losses.
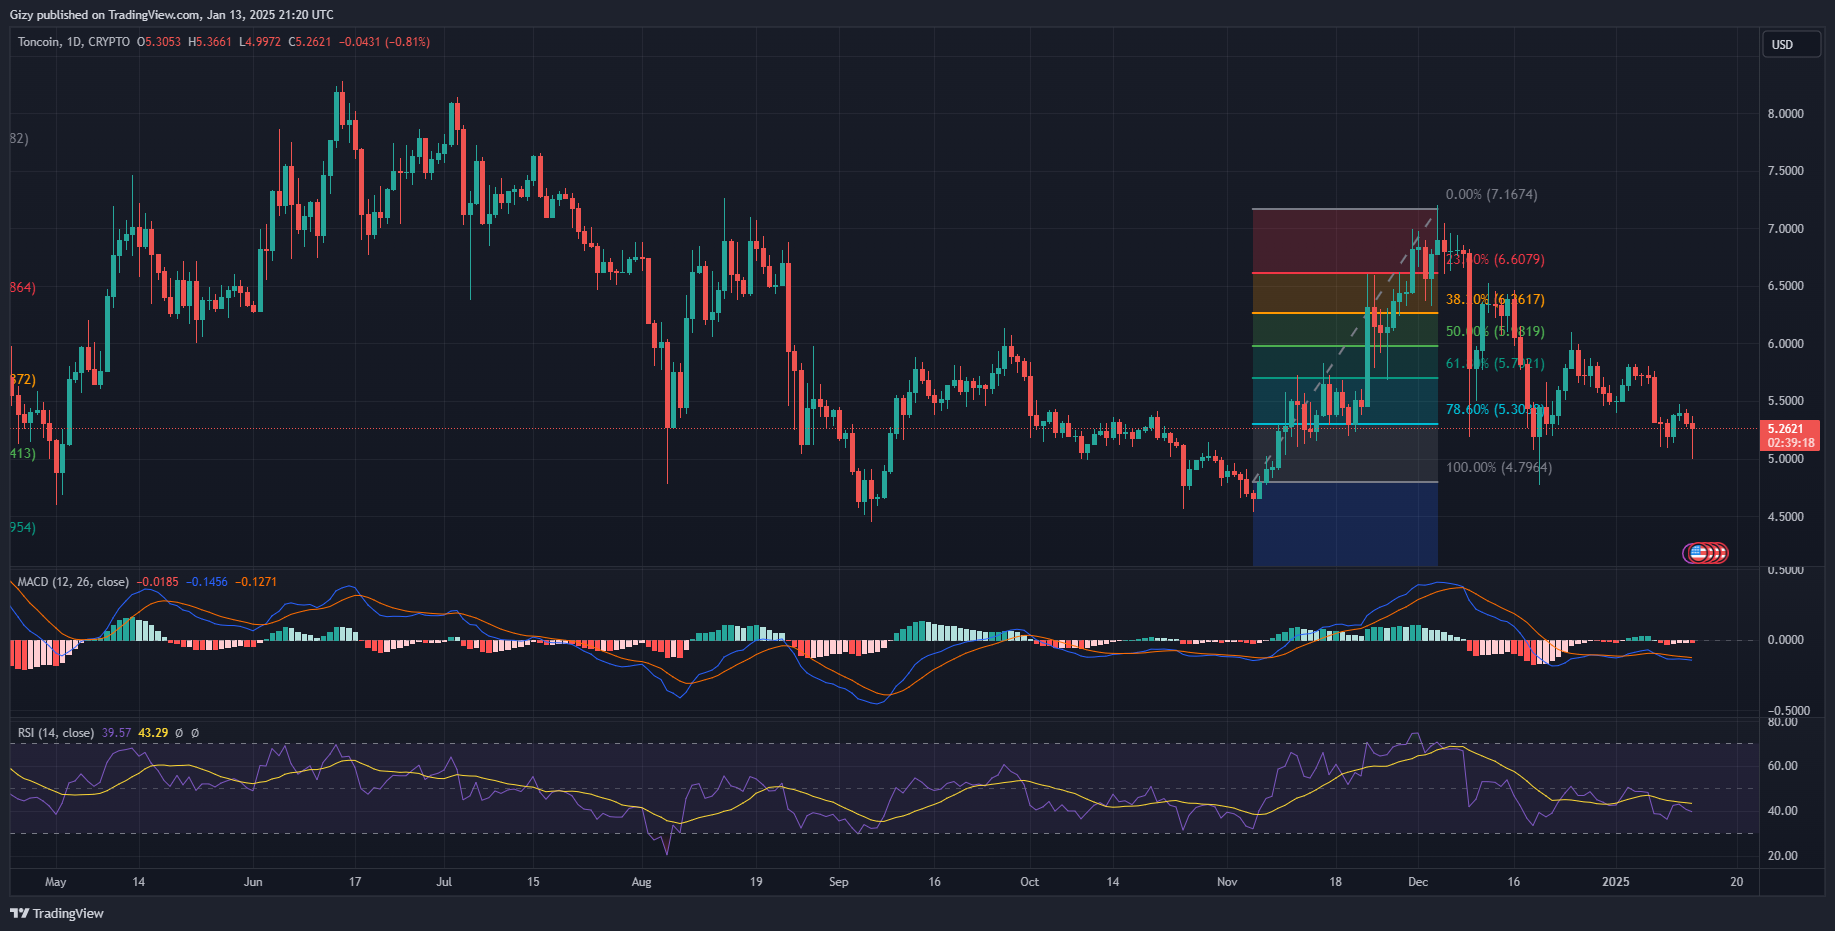
The altcoin’s latest dip off the highlight support raises questions about further decline. The last time it declined below $5, it dipped at $4.73. It remains to be seen if the same will happen again, as indicators are relatively unmoved by the latest price change.
MACD displayed a bullish convergence a few days ago. However, it had a reversal following the previous day’s decline. The 12-day EMA is almost flat at the time of writing. The relative strength index on the downtrend selling continues. Nonetheless, it remains close to 40.
The asset must reclaim the 78% fib at $5.30. After breaking above $5.50, it may attempt $5.70. Failure to hold this critical level may result in a decline to $4.72.
TRX/USD
Tron marks its third consecutive day of downtrends. The downhill movement, which started on Saturday, gradually worsened with each passing day; the most recent was its largest.
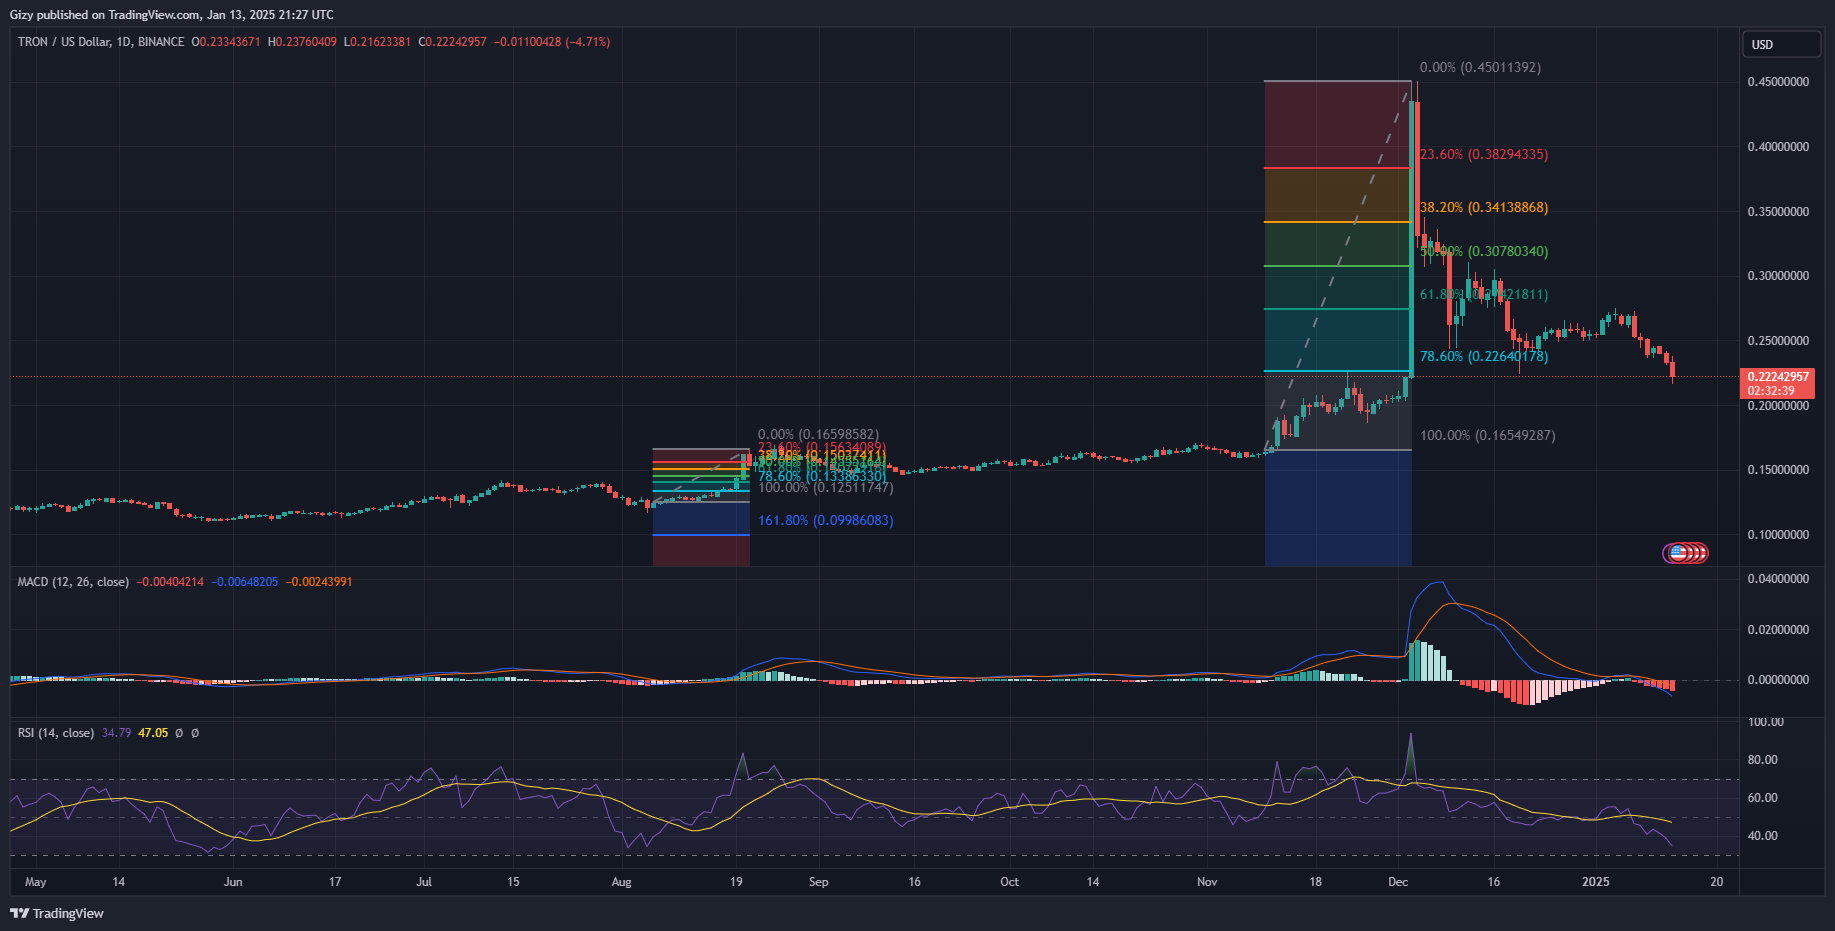
The altcoin is trading at almost 5% above its opening price of $0.233. TRX dipped to a low of $0.216 a few hours ago but rebounded and is currently trading at $0.223.
MACD continues its descent after a bearish divergence a few days ago. The 12-day EMA approaches its December low. The relative strength index is at 34, close to 30. If the downtrend continues, the asset may become oversold.
