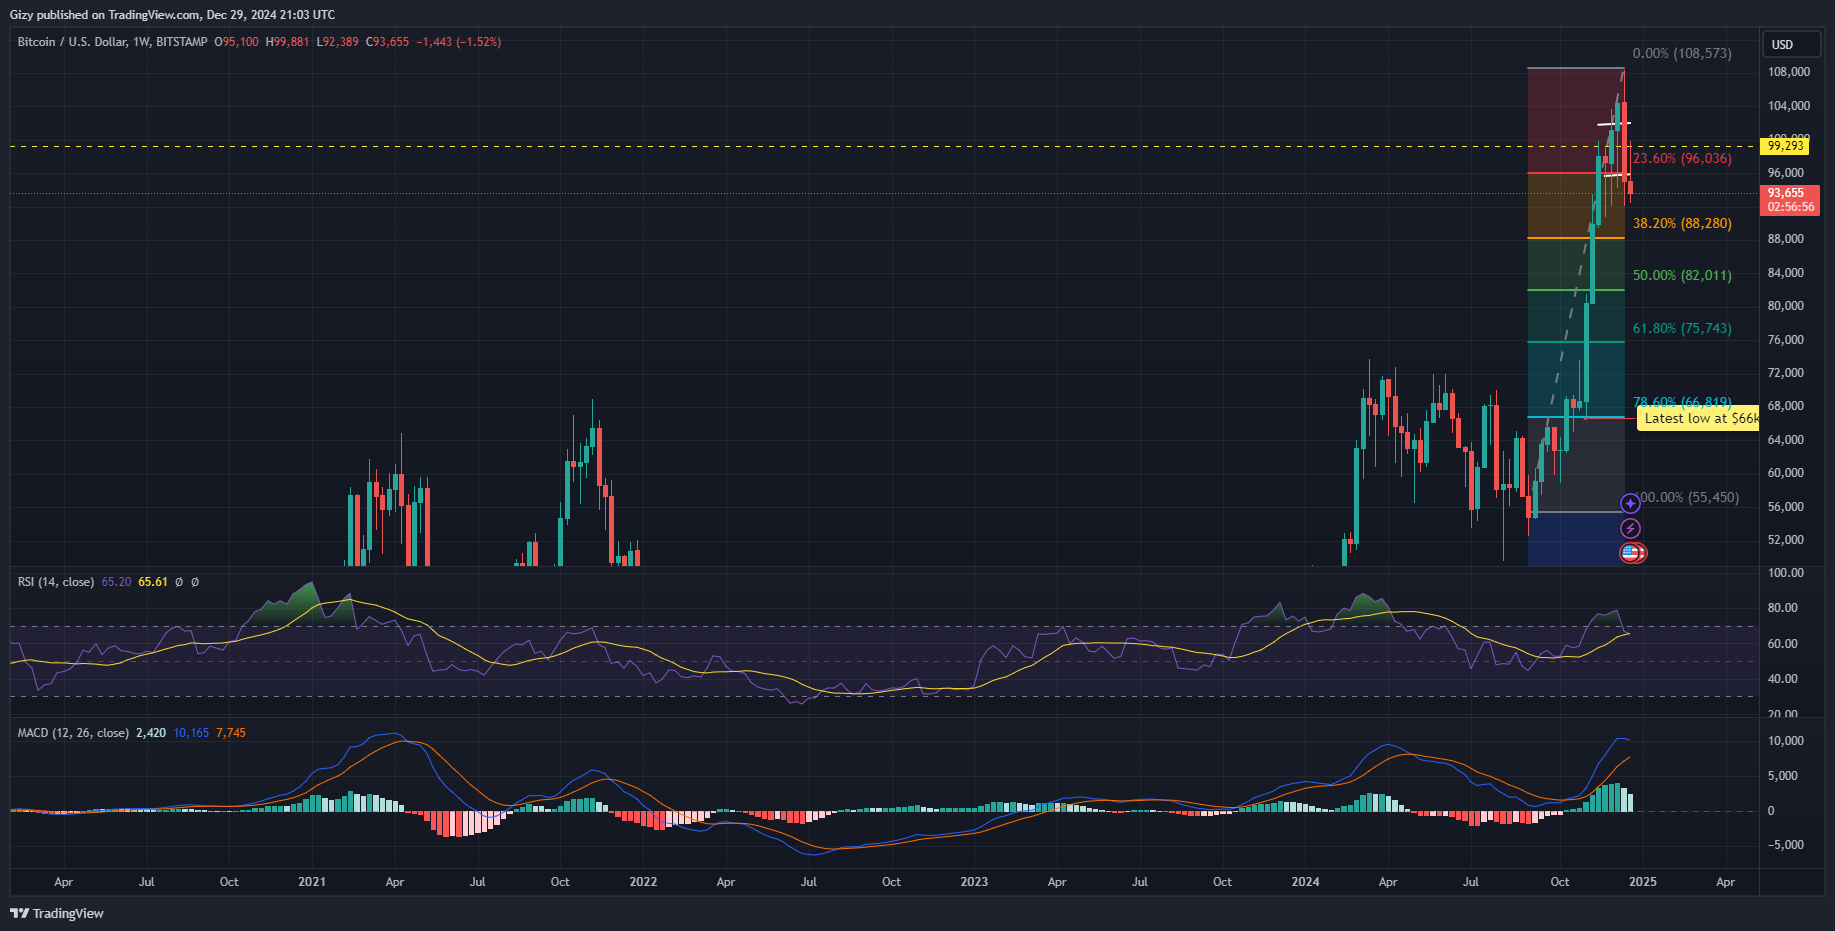
Bitcoin continued its decline, hitting fresh lows a few hours ago. It lost the $94k support and is currently at $93k.
The asset opened Sunday at $95,124 and started retracing as selling pressure. Data from CryptoQuant hints at the asset seeing more bearish activity after a small break on Saturday. The whales continue dumping their assets amidst calls to resume the uptrend.
Robert Kiyosaki accused BlackRock of selling its Bitcoin. The Richdad author claimed that the firm is a Shareholder capitalist and not a stakeholder capitalist. The ideology behind this is to slowly sell assets until owning nothing. Kiyosaki said this may be the reason for the selloffs.
However, the firm has not formally responded to the accusation. Some market watch claimed that the company only sells because its ETF clients are selling off their bags.
Based on the previous assertions that the whales were behind the selloffs, the claims that BlackRock is dumping its BTC may be plausible. Nonetheless, several indicators point to the bears being in control.
Are the Bears in Control?
Onchain data may suggest that the bears are in control. One such metric is the taker buy-sell ratio, which is below 1 at the time of writing. This metric normally falls below 1 when an asset experiences massive selling pressure.
The derivatives market sees more bears’ participation at the time of writing. Short positions make up over 50% of the open interests. The bears are also dominant as more sell orders are filled. The bulls lost over $12 million against the $3.85 million from short position.
Coinbase premium is negative as selling pressure increased compared to the previous day. US traders exhibit weaker buying pressure. This is the same sentiment with Asian traders as Korea premium is negative. The funds premium is also negative as ETFs closed with notable outflows.
The Adjusted Output Profit Ratio reveals that more investors are taking profit. More long-term HODLers are joining the trend, moving their assets to exchanges to sell. However, the number of optimistic traders slightly reduced.
There are no notable fundamentals behind the current declines. However, the previous December trend points to a notable selloff during this period.
Bitcoin Risk Further Decline
The one-week chart reveals more bearish signals. The moving average convergence divergence shows the 12-week EMA halting its decline. As the downtrend enters its second week, it is slightly arched downwards. If trading conditions fail to improve, the asset may start a negative convergence on this scale.

The relative strength index sheds some light on the reason for the consistent declines. A few weeks ago, the BTC/USD pair was above 70, indicating that the asset was overbought. However, it is trending at 65 at the time of writing, as the market sees notable corrections.
The Bollinger bands showed that the pair tested the upper band, breaking out last week. The latest dips may be in reaction to this surge. The metric indicates that the asset will see more declines as it risks a descent to the middle band at $76k.
However, onchain RSI reveals that the apex coin has been oversold and is due for a rebound. The BTC/USD pair approaches a critical support. It has tested then $93k barrier more than three time in the last fourteen days. It rebounded after a small slip below the mark. The same movement may play out in the coming hours.
