Solana is on the verge of another breakout as prices continue upside movements. The latest hike follows the rest of the crypto market as bullish sentiment returns.
The altcoin gained almost 3% as it faced strong rejections to its bid at $200. It peaked at $198 but traded at $194 at the time of writing as selling pressure mounted. The latest increase continues the bullish trend that started on Monday.
SOL trades a few dollars from the lower bollinger band. Nonetheless, several onchain indicators point to factors that will determine next price actions.
One such is the growing bullish sentiment. The crypto and greed index has significantly changed over the last 24 hours. It dropped to a low of 54 at the start of the previous intraday session and has increased to 55 at the time of writing. Although slight, this is the first time it has had such a positive change since Dec. 18.
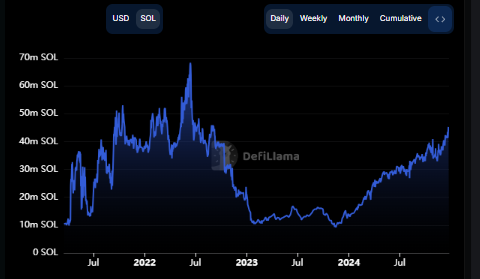
Fresh investments are entering the market, and the influx of new funds has significantly increased the total value locked over the last 24 hours. Data from DefiLlamma showed that TVL increased to 44.2 million SOL. This latest reading is significant, as the total value locked is the highest since September 2023.

The highlight metric points to a massive surge in network activity, as the chart above shows a significant increase over the last year. TVL surged by over 200% in 2024 as users and devs used the Solana blockchain.
Primed for a Rally
The last time the total value locked attained the current level, in 2023, SOL had one of its biggest rallies. The uptrend lasted from September to early March before a reversal. During this period, the coin gained a whopping 900%.

A repeat of this event will result in a massive rally spanning six months. It may break above $500 with the sight set to $700.
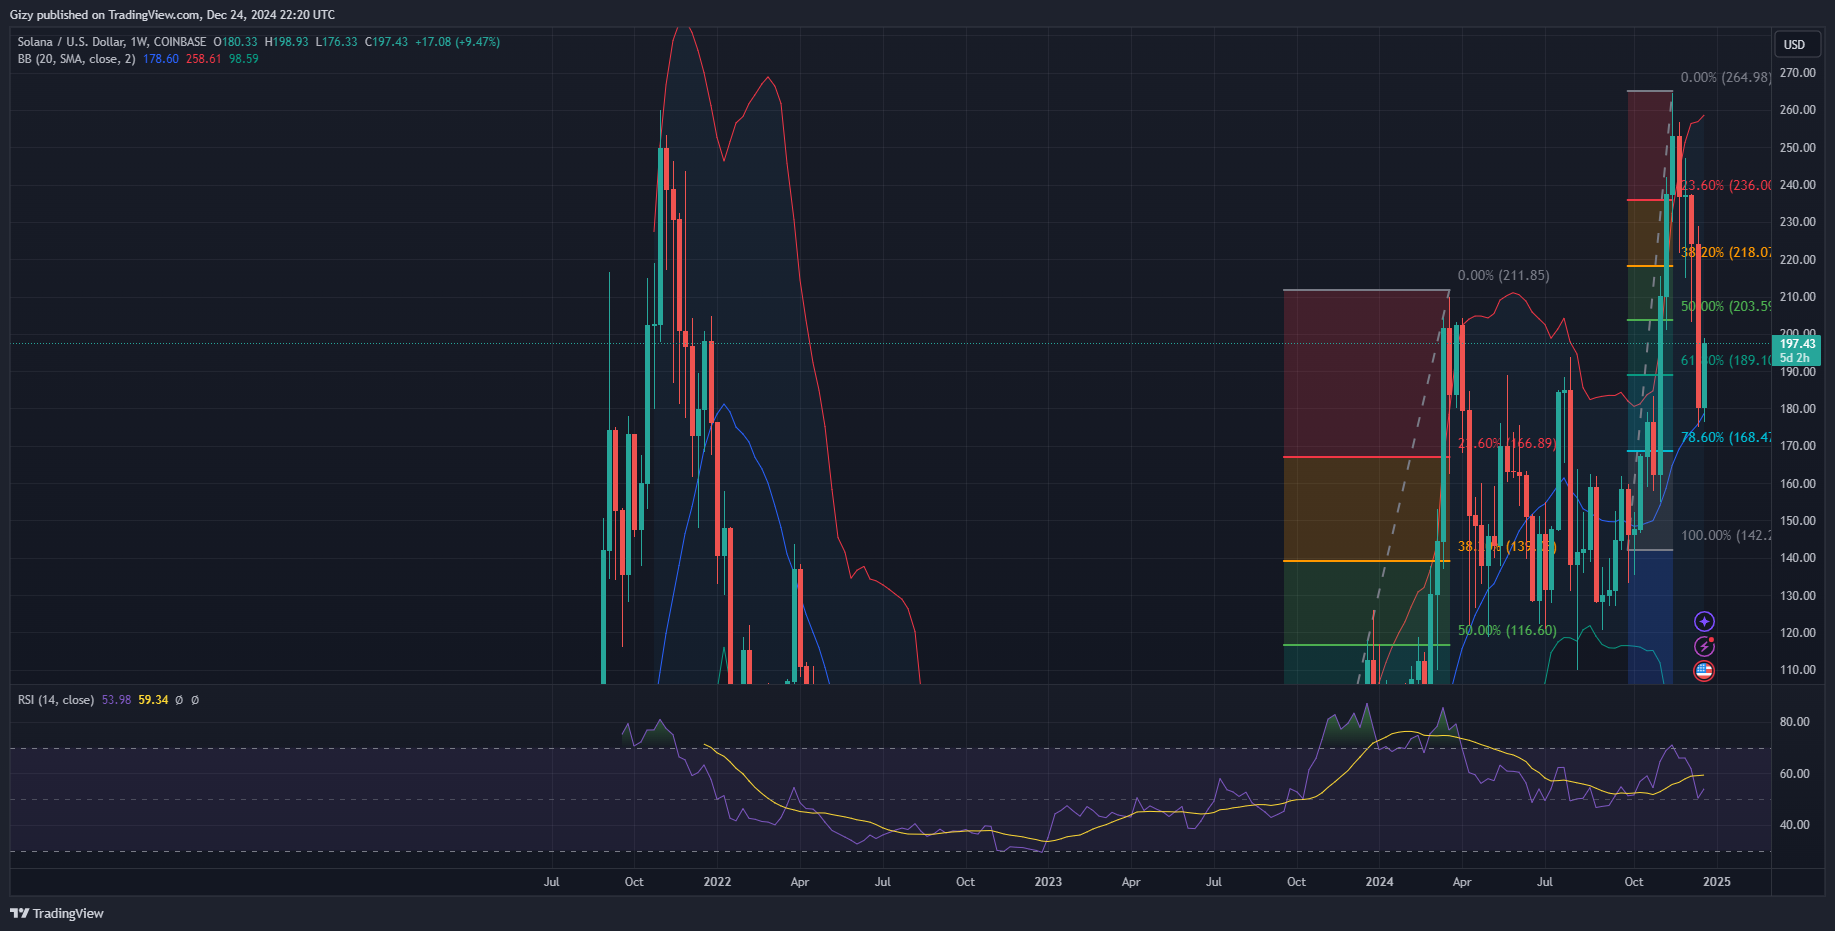
Indicators on the one-week chart suggest room for such an uptrend. The relative strength index in this timeframe is 53 after dipping below 50 the previous week. Its latest descent follows its surge above 70 five weeks ago. This shows a growing bullish sentiment, resulting in a significant increase in funds inflow.
The momentum indicator halted its downtrend due to the highlighted factor. The average directional index shows the downtrend losing strength. Bollinger band reveals that the asset found support above its midline and may surge from this level.
Solana to Flip $220
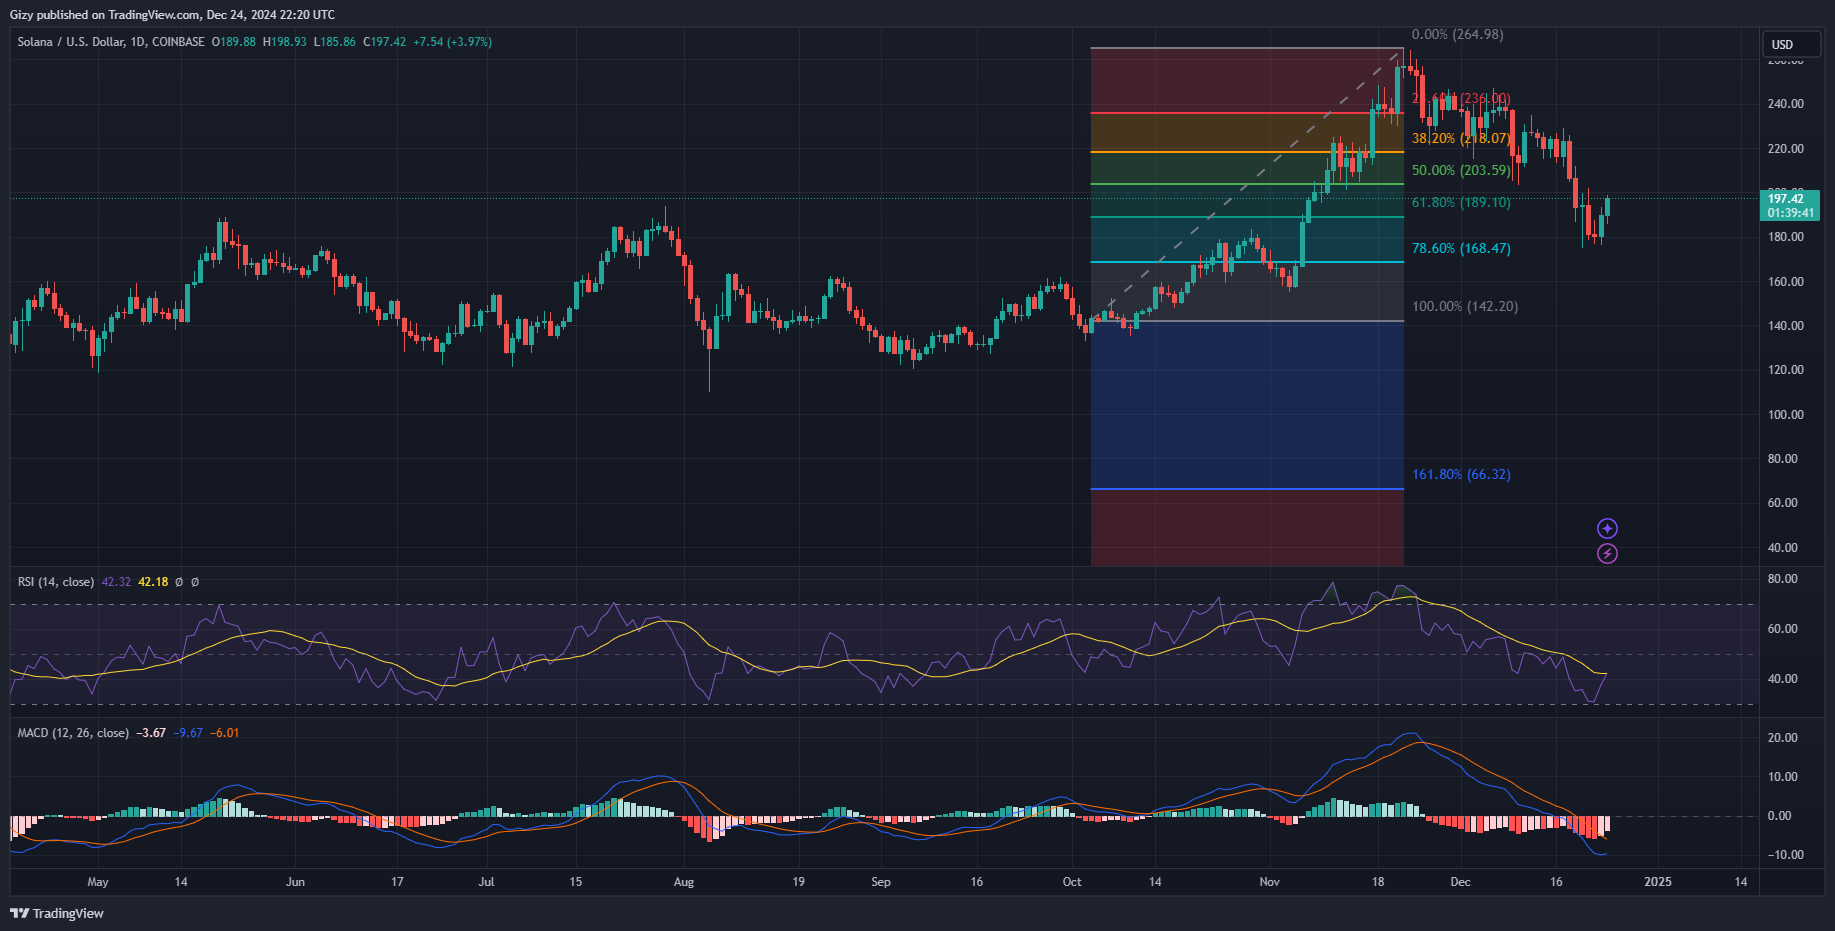
The one-day chart shows that SOL was oversold on Sunday, as RSI slipped below 30. It met buyback shortly after this event. The resulting uptrend sent prices higher. The relative strength index is currently at 41 as buying pressure increases, which may cause price increases.

Other indicators, like the moving average convergence divergence, print positive signals at the time of writing. The 12-day EMA halted its downtrend following the price trend reversal. It is on the uptrend and may start a bullish convergence if the present conditions remain the same.
It is worth noting that the asset slipped below bollinger’s lower band last week. A breakout from the bollinger band almost guarantee massive reversal. The latest slip explains the reason for the price increases. Solana may continue upward until it tests the midline at $214 and the $220 barrier afterward.
