WIF and the rest of the crypto market cap are seeing a massive selloff at the time of writing. The memecoin is printing one of its most extended red candles for over two months.
Nonetheless, the global cryptocurrency market cap is at its lowest over the last seven days. It retraced from $3.67 trillion at the start of the day to a low of $3.40 trillion. One of the main drivers of the ongoing decline are memecoins. This asset class sees massive profit-taking.
One such is PNUT. It started the day at $1.44 and a descent, losing the $1.20. It continued downwards, testing the $1 barrier and rebounding. The altcoin is currently down by over 21% following a slight recovery.
Brett is the second-largest loser of the session. It dropped from $0.21 and lost the $0.19 barrier, losing almost 50% of its value to a low of $0.13. It rebounded, trades at $0.17, and may close with losses exceeding 18%.
The latest declines are surprising, as the crypto market saw huge bullish fundamentals. The Russian parliament started deliberating on investing in a Bitcoin reserve. Microstrategy went shopping again, splashing over $2 billion on more BTC.
The question of whether the market will recover this week is one only time will answer.
Top Five Cryptocurrencies
BTC/USD
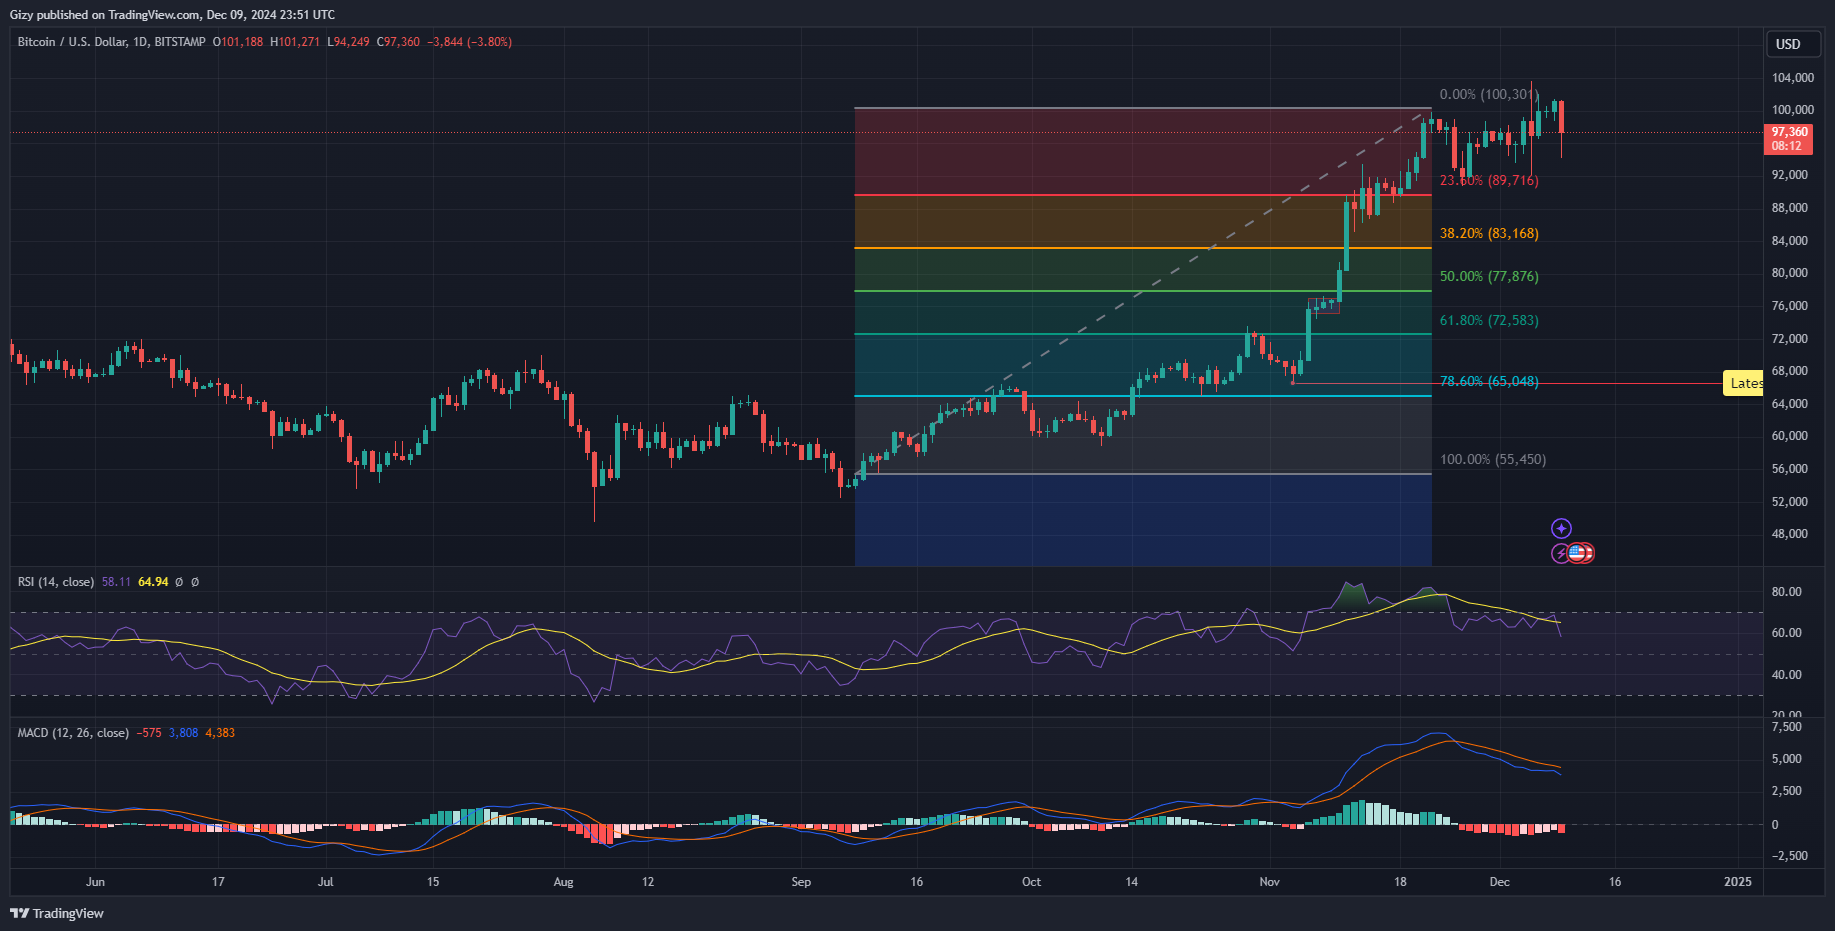
Bitcoin started the day at $101k but retraced. The one-day candle shows a slight uptrend attempt before the decline began. The apex coin dropped below $100k and lost the $98k support. It continued downwards, losing $96k and hitting a low of $94,249. It trades at $96,800, down by over 4%.

The latest decline comes barely a week after BTC attained a new all-time high at $103k. The largest cryptocurrency has since struggled to continue the uptrend. It experienced a massive spike in selling volume, resulting in further downtrends. Nonetheless, fundamentals may be responsible for the latest dip. MicroStrategy’s announcement of its recent purchase became a sell signal for the bears.
Bitcoin’s recovery may hint at the asset resuming its uptrend. A similar event occurred on Nov. 25, when the asset dropped from $98k to a loss of $92k. It recovered and erased the losses before the week ended.
A repeat of that price movement will guarantee that the apex recovers and reclaims $100k. However, it may not see massive price moves within the next six days.
Indicators like the moving average convergence divergence and the relative strength index are currently bearish. The RSI is at 55, the lowest since Nov. 5. MACD shows both EMAs on the decline in response to the ongoing price trend.
WIF/USD
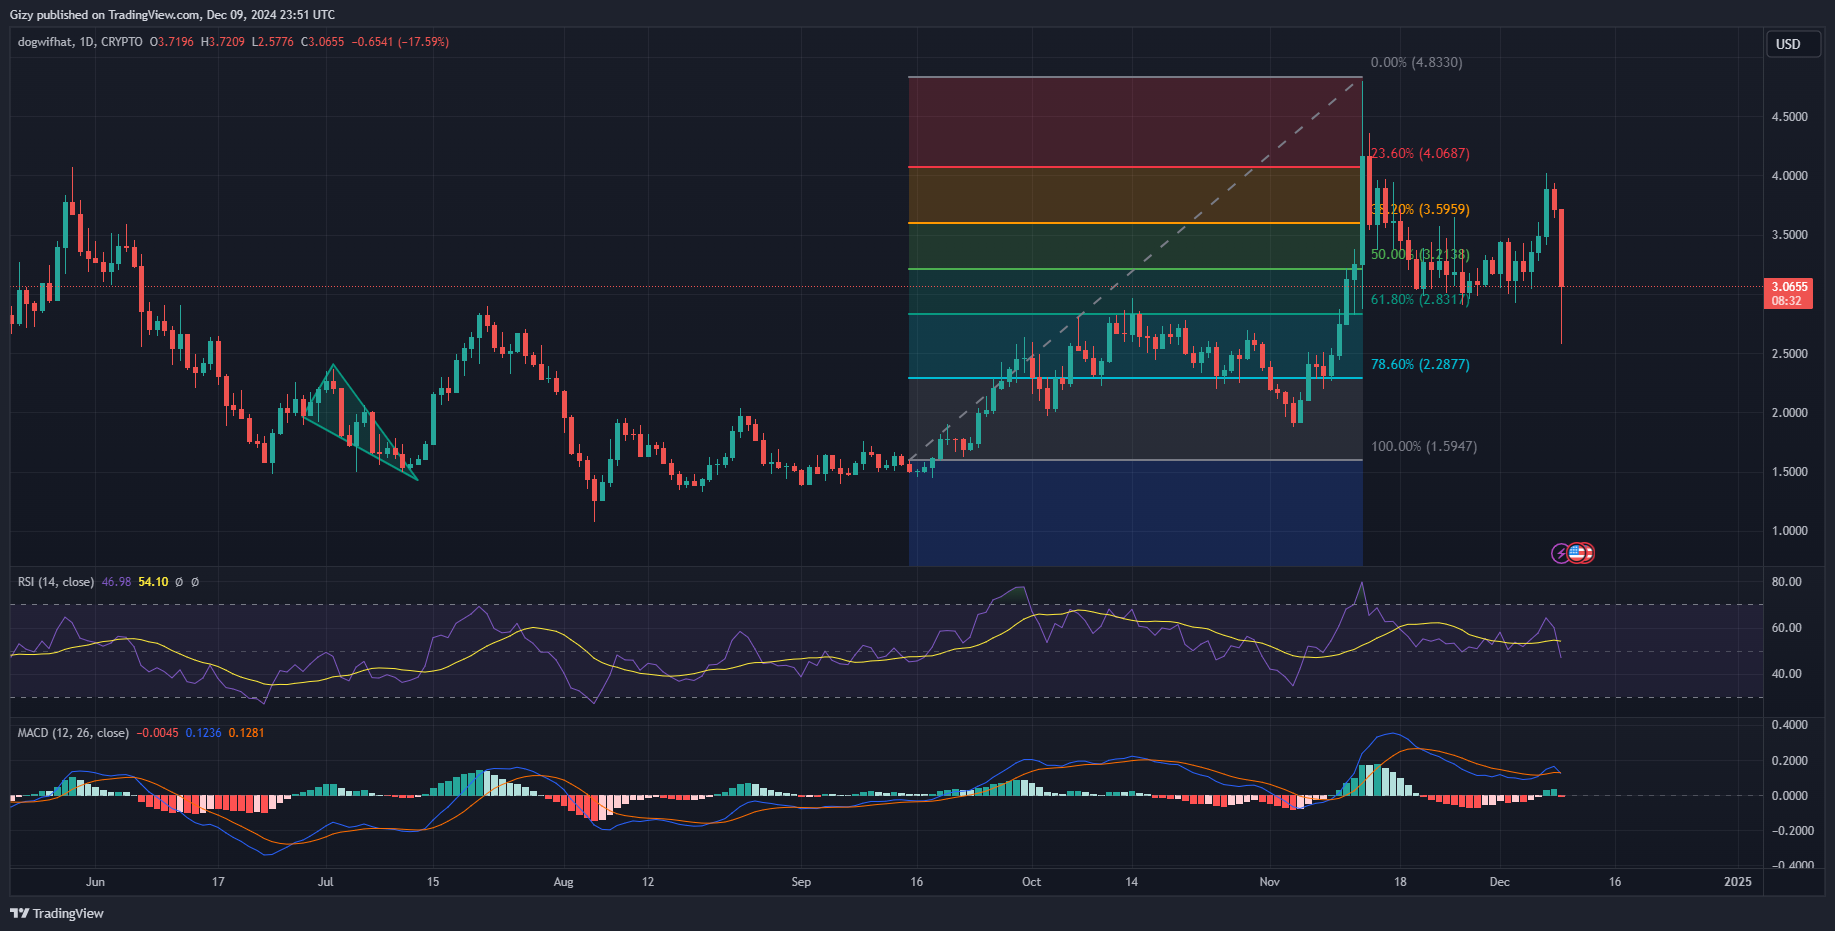
Dogwifhat prints one of its longest red candles this year. It opened trading at $3.71 but retraced as selling pressure increased. The asset is one of the worst hit by the ongoing selloffs, losing several key levels. It dropped below $3.50 and lost the $3 mark. The descent continued until it rebounded at $2.57. The altcoin was down by almost 30% but recovered and trades at $2.98.

WIF still grapples with considerable bearish action amidst the slight recovery. Nonetheless, the current day marks the second consecutive day of notable declines for the asset after a 4% loss during the previous intraday session.
The moving average convergence divergence hints at further decline in the coming days. A few hours ago, the 12-day EMA intercepted the 26-day EMA. MACD’s bearish divergence is ongoing, which many consider a sell signal.
The Fibonacci retracement shows the asset trading above the 61% level. It shows the memecoin reclaimed a critical support filled with notable demand concentration. If the decline continues, it may drop to the 78% fib level at $2.28.
RSI shows no significant change in market sentiment as it dropped to 46 64 the previous day. A change in trajectory will send WIF above the 50% fib level at $3.20.
TIA/USD
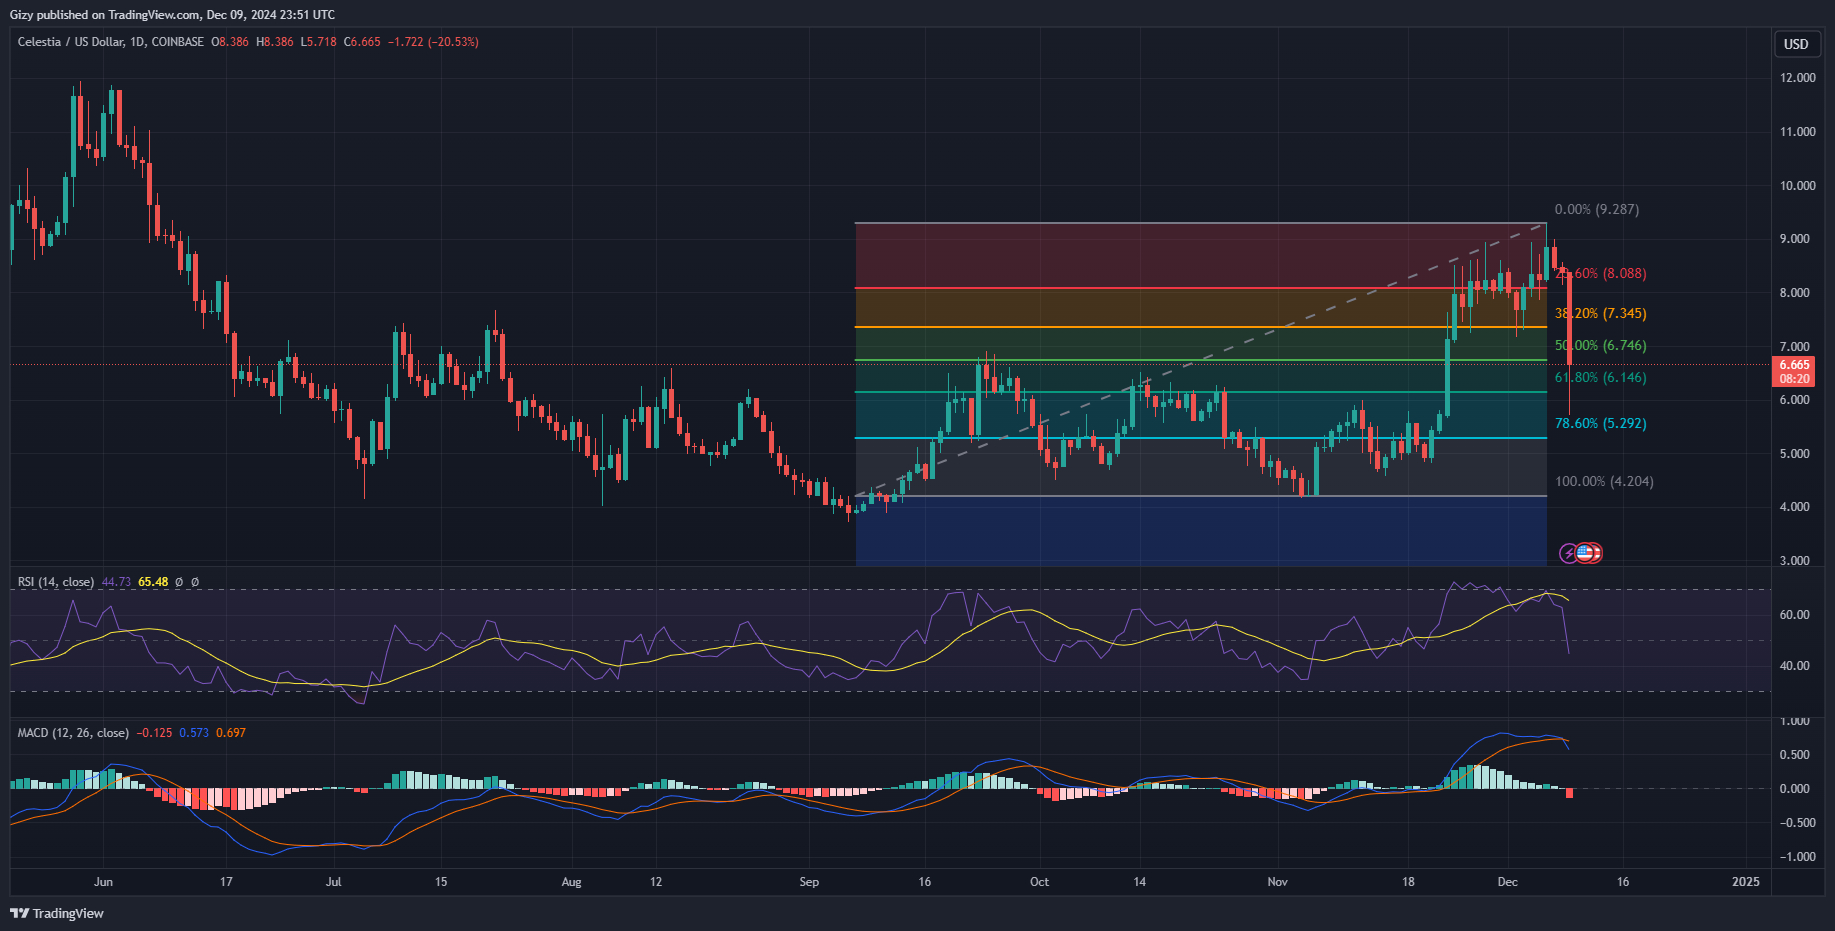
Celestia, like WIF, registered massive declines. It dropped from $8.38, losing the $7.50 barrier. It continued downwards, breaking the $7 support and $6 afterward. The altcoin dropped to a low of $5.71 before rebounding, trading at $6.60 at the time of writing. It may close with losses exceeding 21%.

TIA’s latest decline marks its third consecutive day of significant declines. Following its decline from $8.84 to $8.40, it closed Saturday with losses exceeding 4%. It registered slight declines during the previous intraday session.
The latest attempt at recovery signifies ongoing buybacks. The seller still edges as the relative strength index is 44 from 62 the previous day. Nonetheless, previous price movements show that bulls will rally the cryptocurrency after such declines.
However, MACD prints sell signals at the time of writing. A few hours ago, the 12-day EMA intercepted the 26-day EMA. MACD’s bearish divergence is ongoing, hinting at further declines in the coming days.
The Fibonacci retracement shows the asset trading closer to the 50% level. It shows that the altcoin may reclaim the critical support filled with notable demand concentration. If the decline continues, it may drop to the 78% fib level at $5.29. On the other hand, the metrics point to a possibility at the 23% level if the bulls rally the market.
GALA/USD
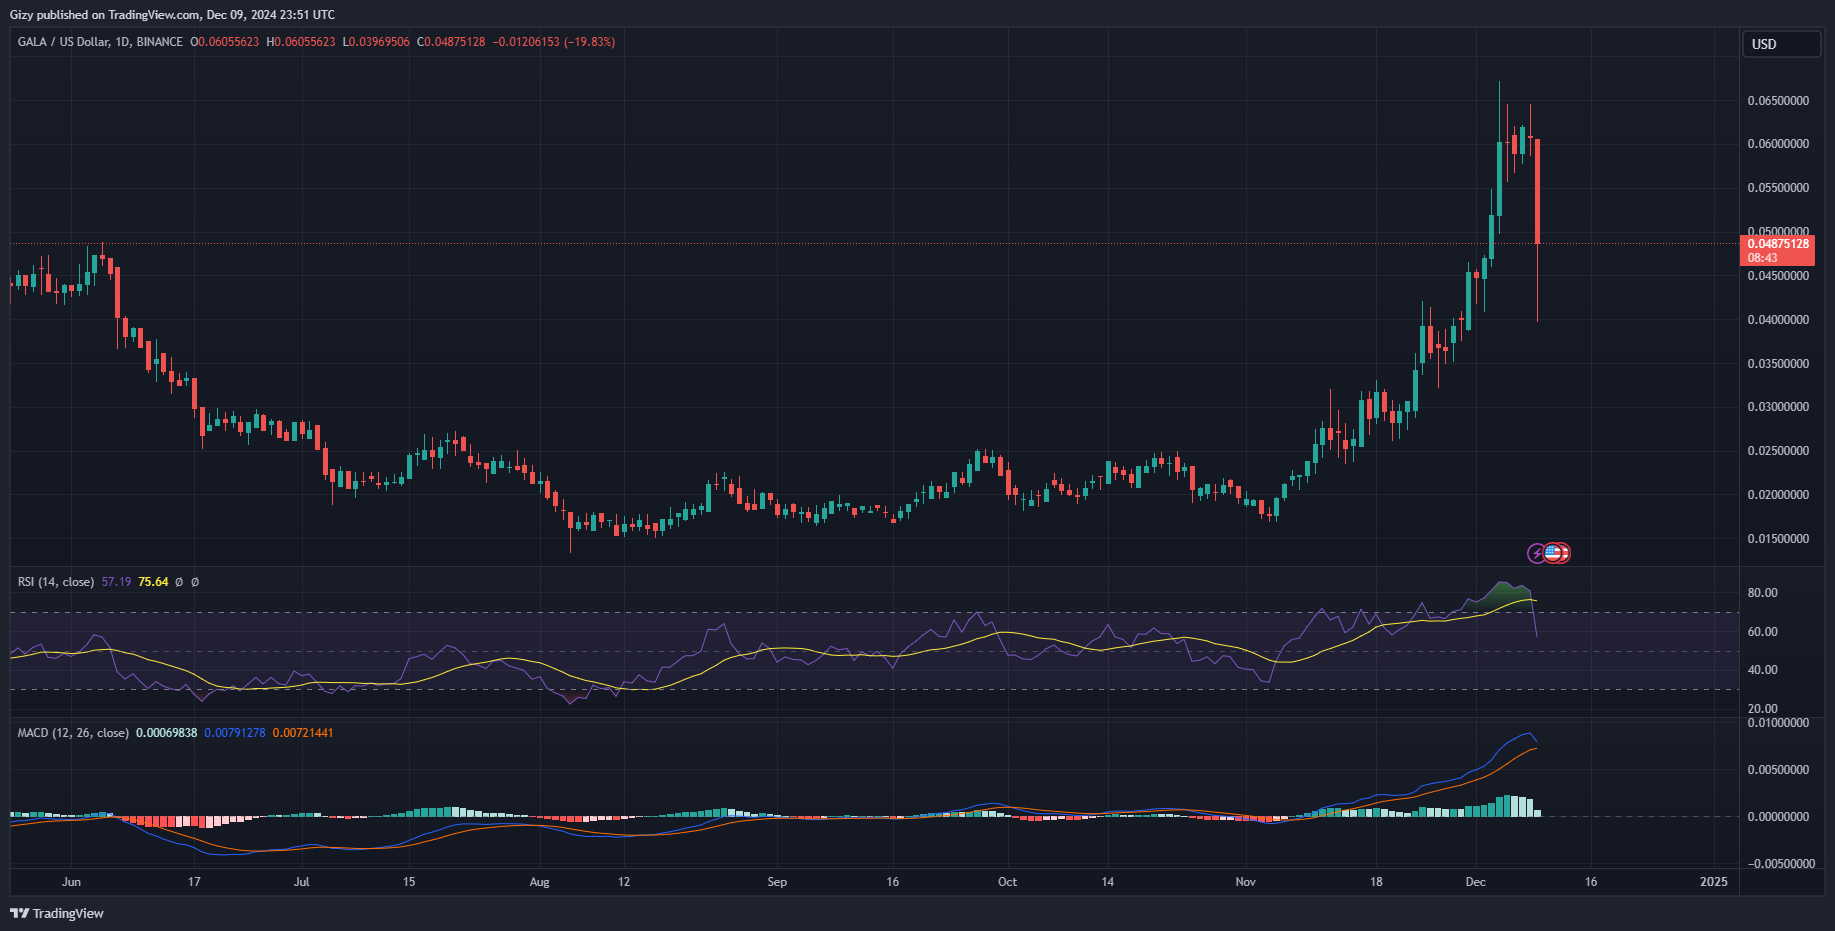
Gala shows signs of recovery after printing one of its longest red candles this year. It opened trading at $0.060 but retraced as selling pressure increased. The asset is one of the worst hit by the ongoing selloffs, losing several key levels. It dropped below $0.55 and lost the $0.50 mark. The descent continued until it rebounded at $0.39. The altcoin was down by almost 35% but recovered and trades at $0.48.

Marking its second consecutive red candle after a doji the previous day. The asset peaked at $0.65 but failed to sustain the momentum during the session.
The altcoin is off to a bad start, as several indicators blare warnings. The moving average convergence divergence prints sell signals at the time of writing. The 12-day EMA halted its uptrend due to the ongoing market trend. It’s arched downwards and may intercept the 26-day EMA if the bearish trend continues.
The Fibonacci retracement shows the asset trading closer to the 38% level. It shows that the altcoin reclaim the critical support filled with notable demand concentration. If the decline continues, it may drop to the 61% fib level at $0.042. On the other hand, the metrics point to a possibility at the 23% level if the bulls rally the market.
