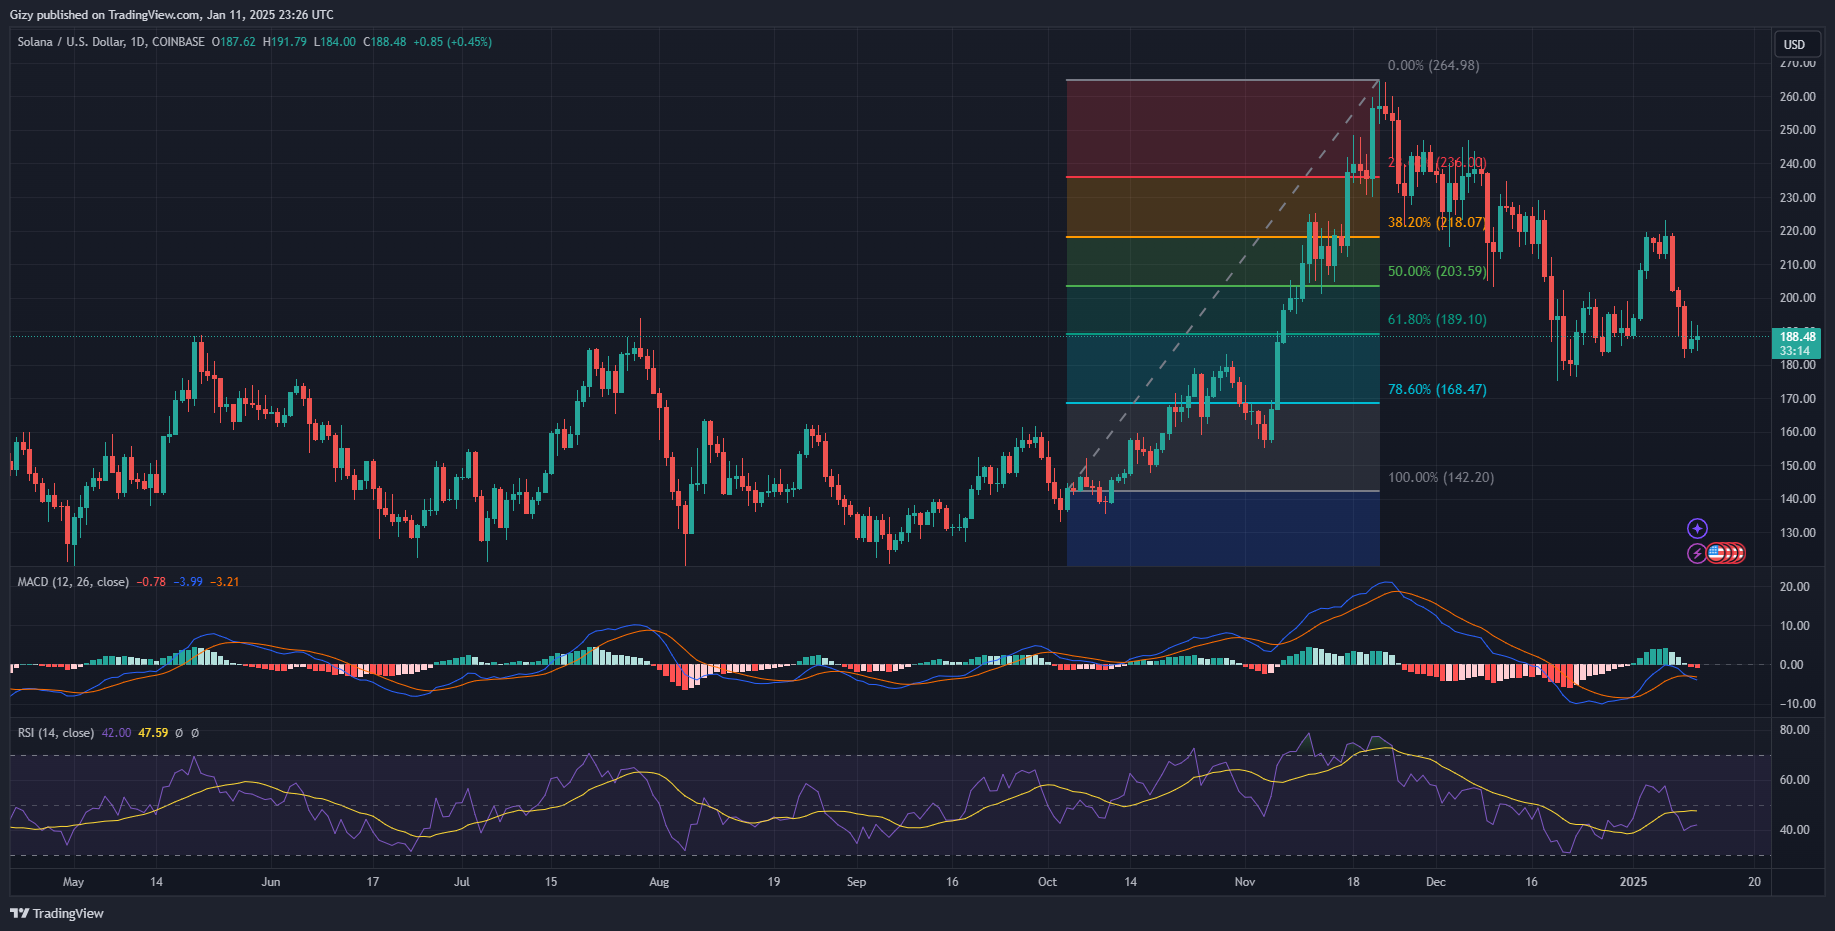
Solana struggles to flip $190 decisively. It peaked at $191 after rebounding at $184 a few hours ago. Currently trading at $189, it may close the day below the mark.
The bulls grapple with significant selling pressure, resulting in no notable price improvement. The SOL/USD pair prints a doji at the time of writing, suggesting it failed to break out.
A closer look at the one-day chart reveals that the cryptocurrency remains under the previous day’s high. It surged to a high of $193 on Friday from $183. Although the current shows small increases, the bulls struggle to continue the uptrend.
Solana Sees More Outflows
The sixth-largest coin, home to several memecoins, is seeing less interaction with its ecosystem. The trend, which started on Wednesday, saw trading drop from $16.5 billion on Thursday to $15 billion on Thursday. Volume further declined Friday to $12.5B.
Data from DeFiLlama shows a significant drop in transactions in the last 24 hours, dipping from 61,4 million TXs to 60 million TXs at the time of writing. The total locked value dropped from 47.5 million SOL to 45.7 million SOL. The netflow is negative at 6.47 million SOL.
While the above metrics are yet to reflect on price, they are a leading sign of growing bearish sentiment among holders. The over 42% drop in the sixth-largest cryptocurrency’s trading volume adds more fear to growing bearish sentiment.
Nonetheless, some assets in the Solana ecosystem are seeing slight upside movement. BONK is up almost 2%. Similar to SOL’s price trend, this marks its second day of slight increases. WIF edged closer to $1.70 but faced small rejections at $1.64. Nonetheless, it is up over 2%.
Indicators hint at both assets gearing for a significant move. Dogwifhat trades at Bollinger’s lower band and is due for a rebound. Bonk sees a similar trend, hinting at a possible end to the slow trend.
Indicators Remain Negative
The slight improvement in prices is yet to cause a change in the trajectory of several indicators. The moving average convergence divergence has a negative interception. Such interception that sees the 12-day EMA cross the 26-day EMA from above may signify impending selling pressure. It is a sign that SOL is not out of the danger zone.

The Bollinger bands reveal room for more declines. Solana trades at $188, a few dollars from the lower band. A slip to this metric will result in the coin losing the $180 support, veering closer to $170. Nonetheless, further upside movement may send the SOL/USD pair as high as $200 (the middle band).
Nonetheless, the relative strength index shows a gradual increase in buying pressure. The indicator dipped from 45 on Wednesday to 39 on Thursday. It has since halted its decline as the asset sees a slight increase in buying pressure. The same reading on the accumulation and distribution chart shows the bulls gradually soaking up the excess supply.
The bulls must sustain the uptrend or risk further declines. Solana is trading around a critical level, the 61% fib level. Previous price movements reveal that after a decisive flip of this key level, prices went as high as $200. Its latest failure to break the $183 support suggests notable demand concentration that may play a huge role in its bid at the highlighted level.
